Free 4th Grade Math Puzzles (Printable)

Comment

Free 4th Grade Math Puzzles (Printable)

Free Printable 4th Grade Math Puzzles

Whether it’s the start of a new school year, the everlasting stretch between October and April, or the final weeks leading up to summer break, keeping your 4th grade students engaged and interested in practicing and learning math every day is no easy task.

While there a ton of free resources, worksheets, puzzles, and activities for 4th graders available online, they are not all created equally—and, probably, the last thing that you need right now are more repetitive black-and-white practice worksheets.

Fortunately, if you are looking to mix things up and share some math activities that your 4th grade students will actually enjoy working on, then you’re in the right place. This post shares ten 4th Grade Math Puzzles that come in the form of printable pdf worksheets that include complete answer keys and are 100% free.

All of the free math puzzles for 4th grade students are samples from the worksheet libraries available on our membership website. Don’t worry, you do not have to be a member to download or print all ten of the free 4th grade math puzzle pdf worksheets.

Our puzzle worksheets can also be shared on online learning platforms like Google Classroom.

Each puzzle includes a brief description, suggestions for use, and links to learn more in case you are interested in accessing more information about puzzle activities including Two Truths and One Lie, Which One Doesn’t Belong?, our Order of Operations Puzzles, and more!

Additionally, all of our puzzles are designed with research-backed strategies that are proven effective for boosting student engagement and improving student performance. For more information, you can learn more about Stanford Education Professor Jo Boaler and her support of using visual math puzzles and activities to improve engagement and student performance.

Each of the following 4th Grade Math Puzzles includes a preview image along with a link to download.

Wait! Do you want FREE 4th grade math worksheets, activities, and puzzles in your inbox every week? 💁‍♀️ Click here to sign-up for our free email newsletter


10 Free Printable 4th Grade Math Puzzles

4th Grade Math Puzzle #1

▶ Order of Operations

(This puzzle is a sample from the 4th Grade Order of Operations puzzle library available on our membership site)

Puzzle Objective: Use your math skills to find the value of each symbol and the ? in the puzzle.

Download: ⤓ Click here to download your pdf worksheet

You Might Also Like:

The PEMDAS Rule Explained! (free guide for students w/ examples)

Puzzle Preview


4th Grade Math Puzzle #2

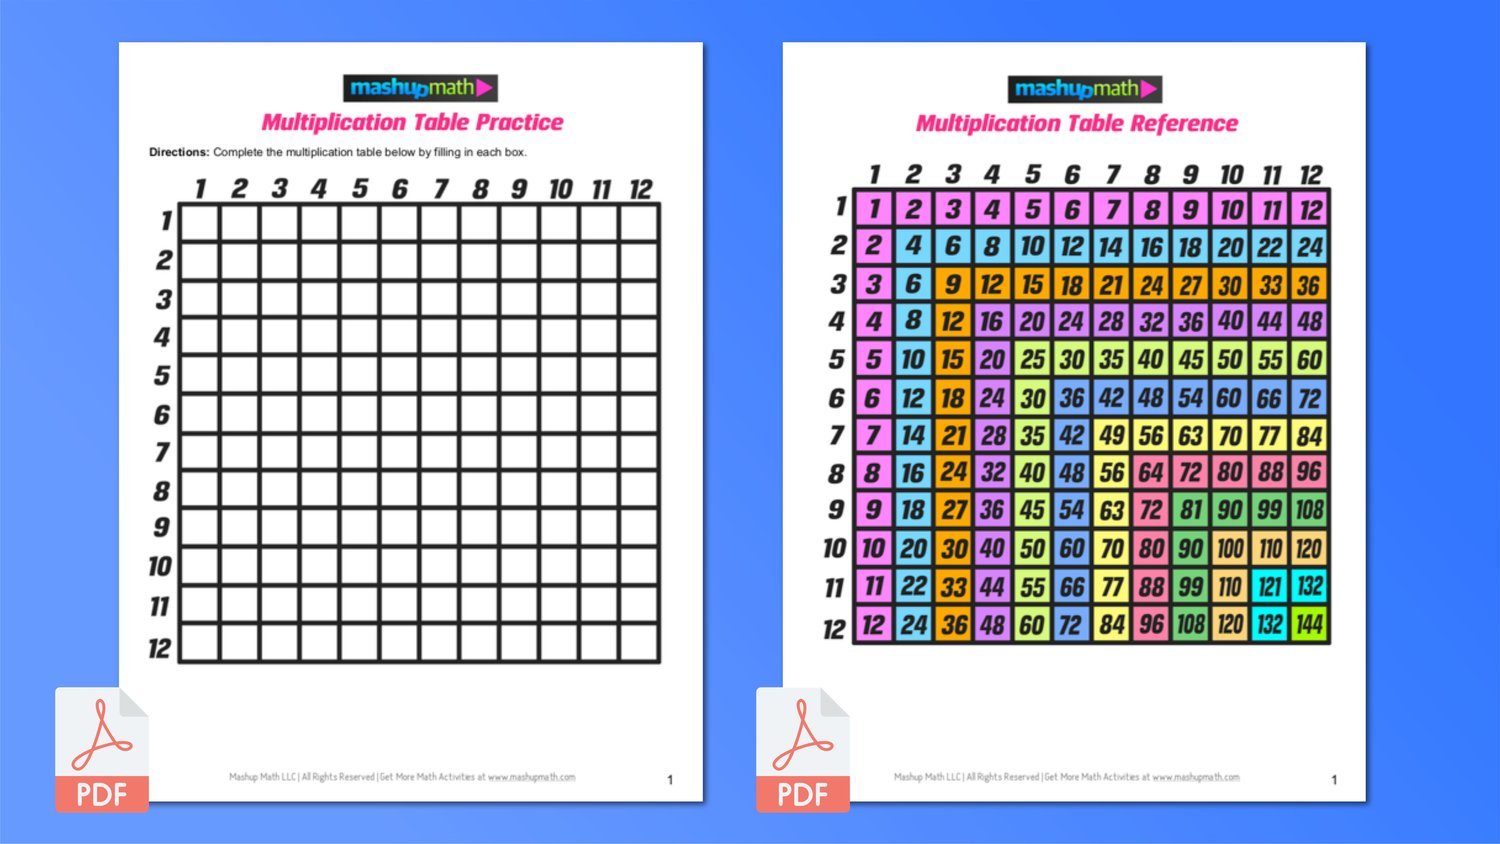
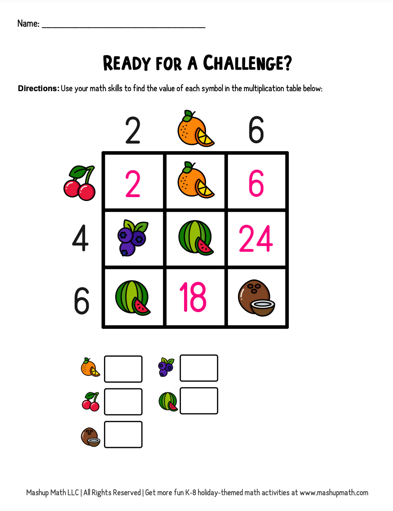
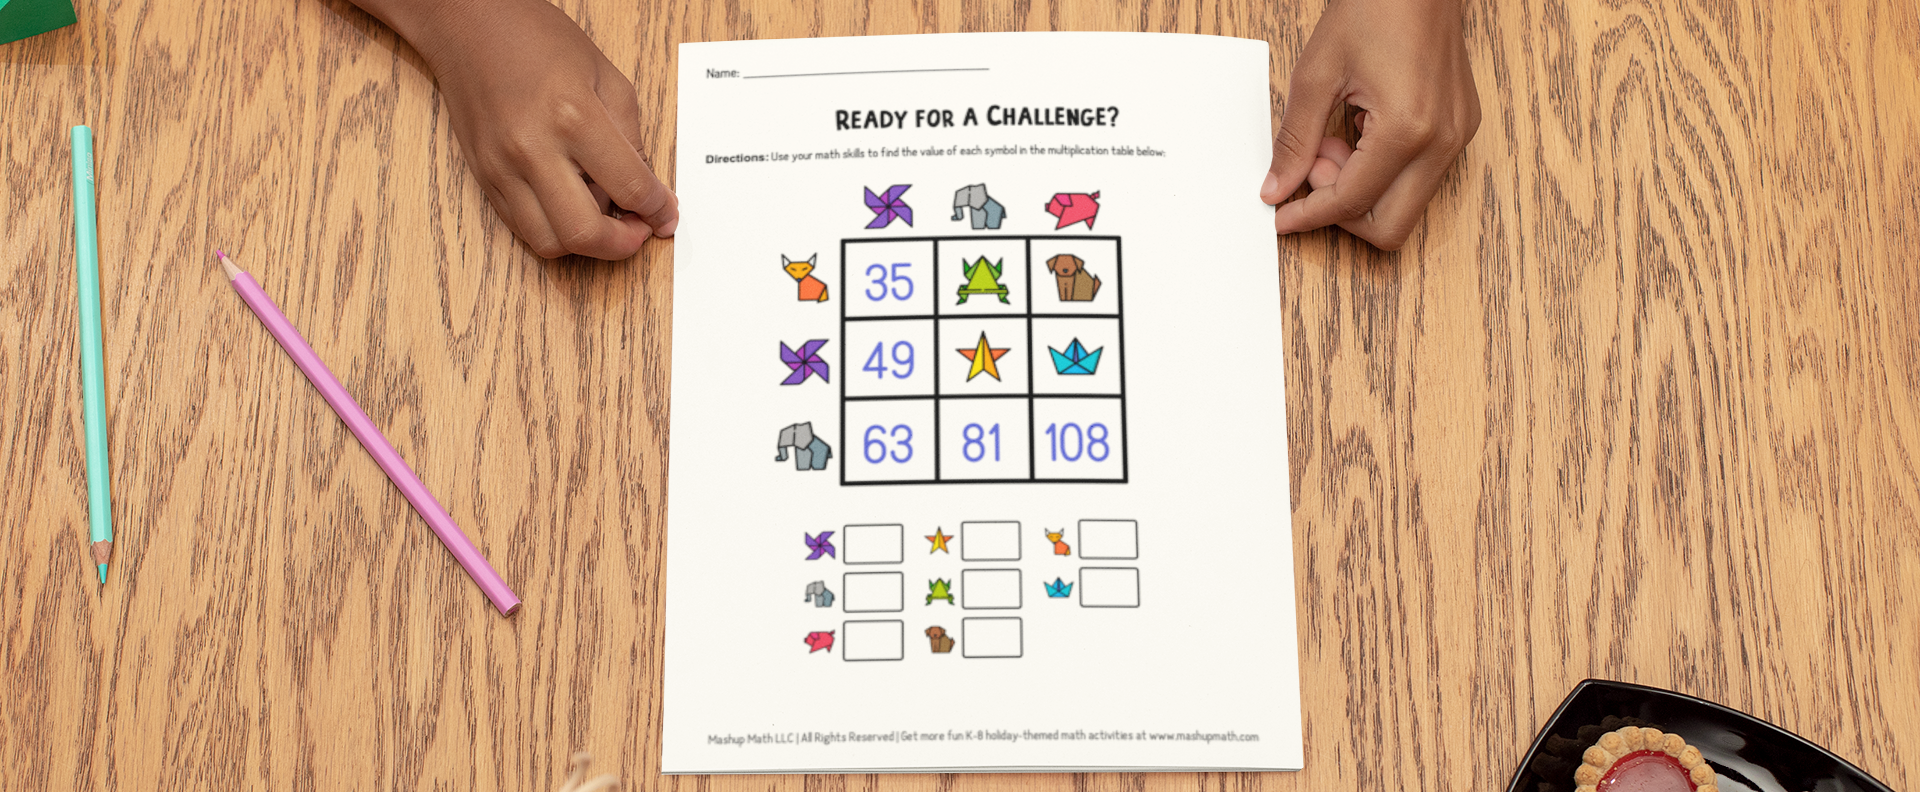
▶ Multiplication Table

(This puzzle is a sample from the 4th Grade Multiplication Tables puzzle library available on our membership site)

Puzzle Objective: Use your multiplication skills to find the value of each symbol in the times table.

Download: ⤓ Click here to download your pdf worksheet

You Might Also Like:

Free Printable Color Multiplication Table Practice Chart for Students

Puzzle Preview


4th Grade Math Puzzle #3

▶ Area Model

(This puzzle is a sample from the 4th Grade Area Models puzzle library available on our membership site)

Puzzle Objective: Find the value of each symbol in the area model so that the entire box represents the given value.

Download: ⤓ Click here to download your pdf worksheet

You Might Also Like:

How to Teach Students to Multiply Using Area Models

Puzzle Preview


4th Grade Math Puzzle #4

▶ Logic Puzzles

(This puzzle is a sample from the 4th Grade Logic puzzle library available on our membership site)

Puzzle Objective: Observe the scales below and use your math skills to find the weight of each object, then answer the follow-up question.

Download: ⤓ Click here to download your pdf worksheet

You Might Also Like:

Gain access to ALL of our 4th grade activity libraries with a membership plan. Start a free 7-day trial today

Puzzle Preview


Do you want more fun and engaging math resources in your inbox every week?

Join our mailing list to get free K-8 math activities, puzzles, and worksheets in your inbox every week (plus two free pdf math workbooks!)

Click here to sign up right now!


4th Grade Math Puzzle #5

▶ Two Truths and One Lie!

(This puzzle is a sample from the 4th Grade Two Truths and One Lie! puzzle library available on our membership site)

Puzzle Objective: Use math skills and the given information to determine which of the three statements is a lie! Explain how you made your decision.

Download: ⤓ Click here to download your pdf worksheet

You Might Also Like:

Idea: How to Engage Your Students at the Start of Any Lesson with Two Truths and One Lie!

Puzzle Preview


4th Grade Math Puzzle #6

▶ Which One Doesn’t Belong?

(This puzzle is a sample from the 4th Grade Two Which One Doesn't Belong? puzzle library available on our membership site)

Puzzle Objective: Carefully observe each of the four graphics and decide which one does not belong with others. Explain your answer in writing.

Download: ⤓ Click here to download your pdf worksheet

You Might Also Like:

Why You Should Be Using "Which One Doesn't Belong?" to Ignite Student Thinking in Math

Puzzle Preview


4th Grade Math Puzzle #7

▶ Think-Notice-Wonder

(This puzzle is a sample from the 4th Grade Think-Notice-Wonder Writing Prompts puzzle library available on our membership site)

Puzzle Objective: Observe the graphic below and, in writing, complete the following: I think…, I notice…, I wonder…

Download: ⤓ Click here to download your pdf worksheet

You Might Also Like:

Are You Using This Genius Strategy for Math Writing?


4th Grade Math Puzzle #8

▶ Riddles and Brain Teasers

(This puzzle is a sample from the 4th Grade Riddles and Brain Teasers puzzle library available on our membership site)

Puzzle Objective: Figure out the relationship/pattern between the numbers to determine the value of the ?

Download: ⤓ Click here to download your pdf worksheet

You Might Also Like:

10 Super Fun Math Riddles for Kids! (with Answers)

Puzzle Preview


4th Grade Math Puzzle #9

▶ Riddles and Brain Teasers

(This puzzle is a sample from the 4th Grade Riddles and Brain Teasers puzzle library available on our membership site)

Puzzle Objective: Figure out the relationship/pattern between the numbers to determine the value of the missing numbers

Download: ⤓ Click here to download your pdf worksheet

You Might Also Like:

Can your students solve the famous handshake math riddle?

Puzzle Preview


4th Grade Math Puzzle #10

▶ Geometry Puzzles

(This puzzle is a sample from the 4th Grade Geometry Puzzles puzzle library available on our membership site)

Puzzle Objective: This one is trickier than you may think! Figure out how many total rectangles are in the diagram.

Download: ⤓ Click here to download your pdf worksheet

You Might Also Like:

Why is a Square also a Rectangle? Video Explanation for Students

Puzzle Preview


Wait!

Do you want on-demand access to hundreds of 4th grade math activities, worksheets, and puzzles like the ones shared in this post?

Why are more and more math teachers using Mashup Math resources every school year? Because our activities are super engaging and loved by students—and having access to all of our resources in one convenient place will take your lessons to the next level and cut your planning time in half!
Plus, all plans include a risk-free 14-day trial so that you can make sure that our resources will be useful to you and your students. Note that you while you do have to enter your payment information to create an account, as long as you cancel during the trial period, you will not be charged.

Click here to sign-up for your free 14-day trial and find out why so many teachers rely on Mashup Math!


Want more free sample worksheets and puzzles in your inbox every week? 💁‍♀️

Click here to sign-up for our free email newsletter


More K-8 Math Resources You Will Love:

Tags: 4th grade math puzzles, math puzzles 4th grade, math puzzles for 4th grade, 4th grade math challenge puzzles, 4th grade math logic puzzles, 4th grade math puzzle worksheets, 4th grade math puzzles pdf, math logic puzzles 4th grade, math puzzle 4th grade, math puzzles for 4th grade printables

Comment

Calculating Percent Change in 3 Easy Steps

Comment

Calculating Percent Change in 3 Easy Steps

Calculating Percent Change in 3 Easy Steps

Learning how to calculate percent change is an immensely handy and essential mathematical skill that has various applications inside of your classroom and in the real world as well.

(Looking for a Percent Change Calculator to make a super fast calculation: Click here to access our free Percent Change Calculator)

The ability to calculate, comprehend, and analyze percentages does not only come in handy on class assignments, assessments, quizzes, exams, the SAT, etc., but also in practical matters associated with every day life and several careers as well. In fact, percentages is one of the most useful math skills outside of the classroom, so understanding them is should not be discounted or overlooked.

While it is common for students to think that calculating percent change can be a confusing and demanding task with many steps, the reality is that correctly solving any percent change problem is actually extremely simple and painless.

Are you ready to learn how to easily solve any percent change problem? This post shares a free Calculating Percent Change step-by-step lesson guide that will painlessly teach you how to calculate percent change using an uncomplicated three-step process. If you can learn how to follow the three-step process demonstrated in this guide, you will gain the ability to swiftly and flawlessly solve any math problems or exercises that require you to find percent change.

Now that we are just about ready to learn the three-step process for calculating percent change, lets quickly review a handful of essential vocabulary words, concepts, and definitions related to percentages and percent change.

Looking to learn how to calculate percent increase or percent decrease? Use the links below to download our free step-by-step guides:

Percent Definition

In terms of numeracy and mathematics, the word percent relates to parts per one hundred and the numerical symbol used to express percentages is %.

A simple example of a percent would be the value 60%. In this case, 60% represents 60 per 100.

Take a look at the diagram below. You should notice that the green shaded region makes up 60% of the whole.

Another way to express percent is to say that it is defined as a ratio of a value out of one hundred.

For another simple example, consider 30%. In this case, 30% is defined as 30 out of every 100. When viewing percentages as ratios of values out of one hundred, you can conclude that if 30% of 500 total people ride the train to work, then 150 total people ride the train—since 30 out of every 100 means that for every group of 100, we have to consider 30 people. So, 30 x 5 = 150 and 30% of 500 is 150.

Absolute Value Definition

To correctly calculate percent change, you will have to use absolute values. So, let’s do a quick review before we move on.

In math, the absolute value of a real number x, denoted using the vertical brackets |x|, is the positive (or non-negative) value of x.

The key thing to understand is that absolute values are always positive.

For example, the absolute value of 25 is equal to positive 25 AND the absolute value of -25 is equal to positive 25.

  • |25| = 25

  • |-25| = 25

This fact also applies to expressions inside of absolute value bars, for example:

  • | 5 - 7 | = | -2 | = 2

  • | 88 - 10 | = | 78 | = 78

  • | 0 - 33 | = | -33 | = 33

Again, notice how the result is always positive.

Percent Change Definition

Now you are ready to consider the question: what is percent change?

In math, the percent change between two values—a starting value and a final value—is simply the difference between those two values expressed as a percentage.

Note that percent change can also be referred to in terms of percent increase or percent decrease. These terms are more specific than percent change.

  • Percent Increase means that the final value is larger than the starting value. Final Value > Starting Value

  • Percent Decrease means that the final value is smaller than the starting value. Final Value < Starting Value

Note that percent change will be expressed as a number with a percentage (%) symbol attached to it.

As for identifying the starting value and the final value, simply look for the first value that is given and the second value that is given (percent change problems will always involve two values).

For example, if Chris drove 120 miles in September and 150 miles in October, and you wanted to calculate the percent change in miles driven between the two months, you would start by identifying that the starting value is 120 and the final value is 150.


Simple enough? If not, please review the previous section again as being able to correctly identify the starting value and the final value is critical for finding the solution to percent change math problems.

Calculating Percent Change

Are you ready to learn how to calculate percent change by apply our easy three-step process?

For our first example, we will continue with the scenario involving Chris and his monthly driving mileage totals.

Calculating Percent Change Example #1

In our first example, we will calculate the percent change for the following situation:

Chris drove 120 miles in September and 150 miles in October. What is the percent change in miles driven between the two months?

Remember that you already figured out that the starting value is 120 and the final value is 150.

Now, you are ready to apply the three-step process to calculating percent change. Here is a preview of how it will work:


Step 1: Find the absolute value of the difference.

To perform step one, simply take the absolute value of the difference of the starting value and the final value.

  • | Starting Value - Final Value | = ?

In this example:

  • | 120 - 150 | = | -30 | = 30

Again, since absolute value is involved, the end result of step 1 will always be a positive number.

Step 2: Divide the difference by the starting value.

The second step is to take your result from step 1 (30 in this example) and divide it by the starting value (120 in this example) as follows:

  • 30/120 = 0.25

For the second step, you will always express your result as decimal (never as a fraction). Otherwise, you will not be able to perform the third and final step.

Step 3: Multiply by 100

The last step is easy and straightforward: take your decimal result from step 2 and multiply it by 100, then express your final result using a % symbol as follows:

  • 0.25 x 100 = 25.0%

Final Answer: 25% Change (or 25% Increase)

Note that this final answer can also be considered a percent increase since the final value was larger than the starting value (the number of miles driven increased over time).

That’s all there is to it! Applying the three-step process allows you to conclude that there was a 25% change in miles driven between September and October.

Now, let's take a look at another calculating percent change example problem where you will gain more practice applying the three-step process.


Looking for a free Percent Change Calculator?

If you need a faster way to calculate the percent change between two numbers, check out our free Percent Change Calculator tool, which lets you input the starting and final values to get an instant answer!

Click here to access our free Percent Change Calculator for students


Calculating Percent Increase Example #2

Last semester, Ariana spent a total of 107 hours studying for exams. This semester, she spent a total of 86 hours studying for exams. What was the percent change in the total number of hours she spent studying between last semester and this semester?

Let’s start by identifying the starting value and the final value:

  • Starting Value: 107

  • Final Value: 86

Step 1: Find the absolute value of the difference.

Just like Example #1, start by finding the absolute value of the difference of the starting value and the final value.

  • | 107 - 86 | = | 21 | = 21

Step 2: Divide the difference by the starting value.

The next step is to take your result from step 1 (21 in this example) and divide it by the starting value (107 in this example) as follows:

  • 21/107 = 0.1962616822… ≈ 0.196

Remember to express your result as decimal!

Step 3: Multiply by 100

Finally, take your decimal result from step 2 and multiply it by 100, then express your final result using a % symbol as follows:

  • 0.196 x 100 = 19.6%

Final Answer: 19.6% Change (or 19.6% Decrease)

Note that this final answer can also be considered a percent decrease since the final value was smaller than the starting value (the number of hours spent studying decreased over time).

All done! You have concluded that there was a 19.6% change in the total hours Ariana spent studying between last semester and this semester.


Now, let’s gain some more experience using the three-step process for calculating percent change by working through one final example.


Calculating Percent Decrease Example #3

In 2023, 395 students attended the Loha High School Dance. In 2024, 861 students attended the Loha High School Dance. What was the percent change in the number of students who attended the Loha High School Dance between 2023 and 2024?

We will start example #3 the same as the previous two examples, by identifying the starting value and the final value:

  • Starting Value: 395

  • Final Value: 861

 Just like the last two examples, you can solve this problem by following the three-step process:

Step 1: Find the absolute value of the difference.

Start by finding the absolute value of the difference of the starting value and the final value.

  • | 395 - 861 | = | -466 | = 466

Step 2: Divide the difference by the starting value.

The next step is to take your result from step 1 (466 in this example) and divide it by the starting value (395 in this example) as follows:

  • 466/395 = 1.179746835… ≈ 1.18

Step 3: Multiply by 100

Finally, take your decimal result from step 2 and multiply it by 100, then express your final result using a % symbol as follows:

  • 1.18 x 100 = 118.0%

Final Answer: 118% Change (or 118% Increase)

Note that this final answer can also be considered a percent increase since the final value was larger than the starting value (the number students in attendance increased over time).

Also note that it is totally fine to have an end result that is greater than 100%. In this case, a 118% increase means that the number of students in attendance more than doubled!


After working through three percent change examples, you should be feeling more confident in your ability to solve percent change problems using the three-step process. However, I highly recommend working through the examples again to further solidify your understanding so that you are successful on problems.

Conclusion: Calculating Percent Change

You can calculate percent change using a given starting value and final value by applying the following 3-step process:

Step 1: Find the absolute value of the difference between the starting value and the final value.

Step 2: Divide the result from Step 1 by the starting value and always express the result in decimal form.

Step 3: Multiply the result from Step 2 by 100 and express your final answer as a percentage (%).


What about Calculating Percent Increase and Percent Decrease?

Learn how to calculate a percent increase or a percent decrease between two numbers using our free step-by-step guides. Click the links below to get started.


Don’t forget about our Free Percent Change Calculator

Click here to get started using our free Percent Change Calculator


Keep Learning:

Comment

Free Multiplication Table Worksheets for Grades 3-5

Comment

Free Multiplication Table Worksheets for Grades 3-5

Free Printable Multiplication Table Worksheets

One of the most important and fundamental math skills that every student has to learn are the multiplication facts for the numbers one through twelve and beyond.

And one of the most useful and effective tools for helping students to practice, memorize, and understand their multiplication facts is the use of multiplication tables.

Multiplication tables are a great tool for visualizing multiplication facts, the relationships between numbers, and the patterns they create.

But not all multiplication table resources are the same. In fact, many can be extremely redundant and boring to students, often making them lose interest in learning multiplication facts. However, today I am sharing 10 multiplication table worksheets that were specifically designed to be fun, engaging, and effective practice opportunities for your students to practice, memorize, and truly understand multiplication.

In addition to a fun traditional multiplication table worksheet (and accompanying free video lesson), I am also sharing fun multiplication table puzzle worksheets that your students will love. I started using multiplication table puzzles with my students every week last school year, and the results were pretty awesome, especially when it came to improving their ability to multiply and divide values without relying on memorization.

This boost in engagement shouldn’t be surprising, as recent studies have shown that using visual math activities (like multiplication table puzzles) to improve engagement and student performance.

All of the following Multiplication Table Worksheets can be used with students in grades 3-5 and beyond. They are all available as PDF files that are printable and easy to share on online learning platforms including Google Classroom.

Free Multiplication Table Worksheets (Printable Times Table Chart)

Before I share the multiplication table worksheets and puzzles, below is a link to our super popular (and 100% free) 12x12 multiplication chart resources. I recommend making sure that your students are comfortable with the traditional 12x12 chart and the corresponding multiplication facts before moving onto the puzzle worksheets.

Click here to access our free Printable Times Table Chart (completed and blank versions available)


Free Multiplication Table Worksheets (Puzzles)

Once your students have a strong understanding of the traditional 12x12 times table chart and their basic multiplication facts, they are ready to work on the following multiplication table puzzle worksheets.

The following puzzles challenge students to use their math and reasoning skills to find the value of different symbols contained within a multiplication table.

Each table works like a bingo-table where the icon in each box represents the product of its corresponding column and row.

So go ahead and share these worksheets in your upcoming lesson plans! They make for a great warm-up or cool-down activity for sparking mathematical discussion and creative problem-solving!


Multiplication Table Worksheets #1-3

Skill Level: Elementary Multiplication, Single-Digit Multiplication

Worksheet #1: Click here to get your pdf worksheet

Worksheet #2: Click here to get your pdf worksheet

Worksheet #3: Click here to get your pdf worksheet


Do you want more fun and engaging math resources in your inbox every week?

Join our mailing list to get free K-8 math activities, puzzles, and worksheets in your inbox every week (plus two free pdf math workbooks!)


Multiplication Table Worksheets #4-6

Skill Level: Intermediate Multiplication, Single-Digit Multiplication, Double-Digit Multiplication

Worksheet #4: Click here to get your pdf worksheet

Worksheet #5: Click here to get your pdf worksheet

Worksheet #6: Click here to get your pdf worksheet


Multiplication Table Worksheets #7-9

Skill Level: Advanced Multiplication, Single-Digit Multiplication, Double-Digit Multiplication, Multiple Steps

Worksheet #7: Click here to get your pdf worksheet

Worksheet #8: Click here to get your pdf worksheet

Worksheet #9: Click here to get your pdf worksheet


Wait!

Do you want on-demand access to hundreds of grade-specific math activities, worksheets, and puzzles like the ones shared in this post?

Why are more and more math teachers using Mashup Math resources every school year? Because our activities are super engaging and loved by students—and having access to all of our resources in one convenient place will take your lessons to the next level and cut your planning time in half!
Plus, all plans include a risk-free 14-day trial so that you can make sure that our resources will be useful to you and your students. Note that you while you do have to enter your payment information to create an account, as long as you cancel during the trial period, you will not be charged.

Click here to sign-up for your free 14-day trial and find out why so many teachers rely on Mashup Math!


Want more free sample worksheets and puzzles in your inbox every week? 💁‍♀️

Click here to sign-up for our free email newsletter


More K-8 Math Resources You Will Love:

Tags: multiplication table worksheets, times tables worksheets, multiplication table printable, times table chart printable, times table sheet, multiplication table puzzles, printable times table, multiplication grid printable, 3rd grade, 4th grade, 5th grade, third grade, fourth grade, fifth grade, grade 3, grade 4, grade 5, elementary school, middle school, answer key, answers

Comment

The 7 Best Math Conferences for Teachers

8 Comments

The 7 Best Math Conferences for Teachers

What are the Best Math Conferences for Teachers?

Every math teacher should attend a conference at least once every few years.

Why? Because the benefits of attending math conferences for teachers can significantly shape your evolution as an educator. Conferences are a great place to network with fellow educators, learn new things (most conferences give you the flexibility to pursue topics that you are most interested in), discover emerging trends in math education, collect some awesome goodies and gifts, and make new friends.

Beyond these benefits, attending a conference allows you to meet popular math education experts in person, engage in world-class professional development, acquire cutting edge knowledge and teaching ideas that you can bring back to your school, invest in your own personal development, and become inspired.

Attending a math conference for teachers really is the best way to expand your professional circle, interact with educators from around the world, and access your favorite speakers and brands.

So, the only thing left to ask yourself is, which of the following math conference for teachers will you attend?

Top 7 Math Conferences for Teachers

1.) National Council of Teachers of Mathematics (NCTM) Annual Meeting and Exposition

The NCTM annual meeting (held in a different U.S. city every spring) is the premier mathematics education conference. At this conference, you can network and swap ideas, engage with the latest trends and innovation in math education, and discover new teaching strategies that will boost your students’ performance for years to come. Learn More

unnamed-7-e1447342294570.jpg

2.) International Society for Technology in Education (ISTE) Annual Conference

The annual ISTE EdTech Conference (held in a different city in late spring each year) is the premier event for anyone interested in how to use technology to engage students and boost learning outcomes. The conference is a place where tested strategies joined with proven tech tools and resources are on display and teachers are empowered to use technology to transform both teaching and learning. ISTE is also a prime networking event as most major math education brands are in attendance and accessible. Learn More

what-you-need-to-know-iste.jpg

3.) South by Southwest (SXSW) Education Conference and Festival

Held in Austin, Texas each year, the annual SXSW EDU Conference includes a diverse mix of keynote speakers, education workshops, unique learning experiences and research-backed teaching strategies, discussions on educational policy, and films aimed at inspiring and empowering all members of the educational community. Learn More

Rob-Santos-Temple-Grandin-SM-1.jpg
Dh1ER77UcAASiPq.jpg

4.) Long + Live + Math Institute by Carnegie Learning

The Long + Live + Math conference is sponsored by Carnegie Learning and is held in a different U.S. city each year. The annual conference brings together some of the most passionate and influential math educators and thought leaders. With a common goal of helping all of your students reach their highest math potential, this conference is focused on sharing effective and proven math teaching strategies and empowering math teachers to transform their role as educators and become better able to make a difference in the lives of their students. Learn more


“I always look forward to getting my Mashup Math newsletter email every week. I love the free activities!”

-Christina R., 5th Grade Math Teacher, Dallas, TX

Do YOU want free math resources, lesson activities, and puzzles and games for grades 1-8 in your inbox every week? Join our mailing list and start getting tons of free stuff (including a free PDF workbook)!


5.) ASCD Annual Conference

The Association for Supervision and Curriculum Development (ASCD) Conference on Teaching Excellence is a master class for teachers in the most effective and highest trending strategies for effective assessment and instruction. Teachers from around the world attend this event each year to hear expert speakers from all backgrounds share their stories and insights in how to transform your role as an educator and how to best meet the needs of every student. Learn more

1460335642_thumb.jpg

6.) MAA Joint Math Meetings

JMMBooth2014-IMG01-large.jpg

The Mathematical Association of America (MAA) hosts the Joint Math Meetings in a different U.S. city every year. The conference is the largest mathematics meeting in the world and is geared towards mathematics enthusiasts and those interested in trends and advancements in the field of mathematics and the corresponding research, how to make math more accessible and enjoyable for people of all ages, and networking with the worldwide mathematics community. Learn more


7.) National Council of Supervisors in Mathematics (NCSM) Annual Conference

Each year, the NCSM hosts a short conference geared towards networking, learning how to create and/or support a successful math program in your school, and strategies for building interest and enthusiasm for learning math in your school. NCSM is a great place for aspiring to math specialists, administrators, and/or anyone interesting in taking on a leadership role in math education. Learn More

NCTM.jpg

Keep Learning:

8 Comments

What is Point-Slope Form in Math?

Comment

What is Point-Slope Form in Math?

What is Point-Slope Form?

Arranging equations in a particular format gives us insight into specific features of an equation. The point-slope form is one such form used with linear equations and is useful when building an equation of a given straight line.

Let’s walk through what the point-slope form is, and learn its use cases with examples.

By the end of this lesson guide, you will be able to construct linear equations in the point-slope form and interpret features like slope, y-intercepts, and x-intercepts.

What are the different forms of linear equations?

A linear equation or an equation of a straight line can be represented in three main forms. These forms are namely:

  • Standard form

  • Slope-intercept form

  • Point-slope form

The major differences between these forms are the way that the properties of a linear equation are presented within the equation. The key properties that are involved in a straight line are the slope and its intercepts (y-intercept and/or x-intercept).

 The standard form, also known as the general form of linear equations, is Ax + By = C, where A, B, and C are constants. Using the standard form to represent a straight line makes it easier to obtain the y and x-intercepts using substitution.

The slope-intercept form is the most commonly used form and is of the form y = mx + b, where m and b are constants. The benefit of using the slope-intercept is that the slope and y-intercept of the straight line can be obtained directly by observing the equation, as m is the slope, and b is the y-intercept.

What is Point-Slope Form?

The point-slope form is another form in which a linear equation with two variables can be represented. As the name suggests, to construct an equation in the point-slope form we require a point on the straight line and its slope.

Definition: The point-slope form of a line is expressed using the slope of the line and point that the line passes through.

Formula: y-y1 = m(x - x1) where m equals the slope of the line and x1 and y1 equal the corresponding x- and y-coordinates of a given point the line passes through.

The general structure of an equation in the point-slope form is: y - y1 = m*(x - x1)

Here (x1,y1) is any arbitrary point on the straight line, and m is the slope/gradient of the straight line. Following is a table that shows a side-by-side comparison of the same straight line represented in the three forms mentioned above.

Again, notice each equation is a different way of expressing the same linear function, namely one with a slope of 2/3 and a y-intercept of 5.

One of the unique properties of the point-slope form compared to the other forms is the flexibility in its structure. This flexibility comes from the fact that you can use any point on a particular straight line to build the point-slope form equation.

In fact, below are some out of infinitely many other valid point-form equations of the straight line above.

  • y - 9 = ⅔*(x-6)

  • y - 3 = ⅔*(x+3)

  • y +1 = ⅔*(x+9)

 Next, let’s find out more about the fundamentals behind the point-slope form.

Fundamentals of the point-slope form

The main concept behind the point-slope form is the formula for determining the slope of a straight line. The formula that is used to calculate the slope of a straight line is :

m = (y2 - y1)/(x2 - x1)

Here, m is the slope of the straight line, while (x1,y1) and (x2, y2) are the coordinates of any two points on the given straight line.

Let’s apply the slope formula to find the slope of the line given in the graph below:

(y - y1)/ (x - x1) = m

Multiply both sides by x - x1, and we get

y - y1 = m * (x-x1), which is the general structure of the point-slope form.

As mentioned before, we can replace (x1,y1) with the coordinates of any point that lies on the given straight line. Note that if you select the y-intercept (b,0), then you will end up with the slope-intercept form of the equation.

y - b = m*(x-0)

y - b = mx

y = mx + b → the slope-intercept form

Therefore, the slope intercept can be considered a special case of the point-slope form.

Now with this fundamental understanding let’s see how we can construct the equation of a straight line in point-slope form using a variety of examples.


Point-Slope Form Examples

The information provided in a scenario can be different, but the goal is to determine the slope and the coordinates of a point that lies on a straight line.

Example #1 Finding the point-slope equation from slope and a point

Problem: Consider a straight line that has a slope of -7 and passes through the point (5, -3)

We can directly substitute the given data into the point-slope general equation below:

y-y1 = m*(x-x1)

Here m is the slope, hence it is -7 in this example. The point (5,3) is the arbitrary point (x1,y1). By substituting the terms we get:

y - - 3 = -7*(x - 5)

Hence,

y + 3 = -7*(x - 5) is the point-form equation of the straight line.


Example #2 Finding point-slope equation from two points

Problem: Consider a straight line on which the points (-2,1) and (1,10) lie. Determine the equation of the line in point-slope form.


First, we can use the slope formula to determine m (slope) of the line.

m = (y2- y1)/(x2-x1)

Substituting (-2,1) and (1,10) we get:

m = (10-1)/(1- - 2)

m = 9/3

m = 3

Now that we have determined the slope of the line to be 3, we can build the point-slope equation.

y-y1 = m*(x-x1)

We can pick any point on the line for (x1,y1). Here let’s use (-2,1).

y - 1 =3*(x- -2)

Hence,

y - 1 = 3*(x+2) is the point-form equation of the straight line.


Example #3 Determining features from the point-slope equation

Problem: Which of the following graphs represents the straight line of equation y - 4 = -2(x + 3)


The equation provided is in the point-slope form. By comparing y - 4 = -2(x+3) and y - y1 = m*(x-x1), we can work out that:

m = -2, and (x1,y1) is (4,-3)

So we must look for a graph that has a slope of -2 and passes through (4,-3). Since only black, red, and blue lines clearly pass through (4,-3), we can eliminate the rest.


Amongst the three, only the black has a negative slope. Hence the line that represents the point-slope equation of y - 4 = -2(x+3) is the black graph.


Looking for more point-slope form example problems?

Are you ready to extend your thinking and work through 5 more point-slope form practice problems with step-by-step explanations and answers included? Click the link below to access our free guide for students:

5 Point-Slope Form Example Problems for Students


Conclusion: Point-Slope Form

Amongst the three main forms of representing linear equations, the point-slope form can be considered the most versatile. By identifying the slope and a single point that lies on a straight line you can determine the point-slope of an equation. The type of information you get about a straight line may change, hence you should utilize the necessary formulas and/or visual interpretations of graphs to extract what you need.


Keep Learning:

Comment