How to Find Domain and Range of a Graph Explained
Step-by-Step Guide: How to Find Domain and Range of a Graph Function, How to Find the Domain and Range of a Graph
Step-by-Step Guide: How to find domain and range of a graph explained.
In algebra, every function can be represented as a graph on the coordinate plane. The graph of a function provides a visually representation of how the function behaves and gives you important information—including its domain and range.
This free Step-by-Step Guide on How to Find Domain and Range of a Graph Function will teach you everything you need to know about finding the domain and range of function by looking at its graph and it includes the following sections:
You can click on any of the quick links above to jump to a section, but we highly recommend that you work through each section in order to get the most out of this free guide.
Now, let’s do a quick review of some important vocabulary terms and concepts that you will need to be familiar with in order to learn how to find the domain and range of a graph.

Figure 01: Before you can learn how to find the domain and range of a graph, you have to be familiar with interval notation.
What is Interval Notation?
Before we review the meaning of domain and range and how to find domain and range of a graph, it is important that you are familiar with interval notation.
Interval Notation is used to describe a certain set of numbers using either parenthesis or square brackets.
Square Brackets: When an endpoint is included in a given set of numbers, we use square brackets that look like [ or ].
Parenthesis: When an endpoint is not included in a given set of numbers, we use parenthesis that look like ( or ).
In this section, we will use simple inequalities to teach you to understand interval notation. We will then extend this understanding to using interval notation when finding the domain and range of a graph.
Let’s consider the inequality x>4 as shown on the graph in Figure 02 below.
Notice that all numbers greater than 4, but not including 4, are solutions to this inequality.
Also notice that the arrow extends to the right forever towards infinity and that there an infinite number of values that would satisfy this inequality (i.e. there are an infinite amount of numbers that are greater than 4.

Figure 02: The inequality x>4 (x is greater than 4) on the number line.
We could express the solution to the inequality x>4 verbally as:
x is greater than 4 (i.e. x can be any number greater than 4, but not including 4)
And we could express the solution to the inequality x>4 using interval notation as:
(4,∞)
Notice that, since 4 was not included in the solution set, we used parenthesis instead of square brackets.
Now let’s consider the inequality x≥4 as shown on the graph in Figure 03 below.

Figure 03: The inequality x≥4 (x is greater than or equal to 4) on the number line.
Notice that all numbers greater than 4, and including 4, are solutions to this inequality.
We could express the solution to the inequality x≥4 verbally as:
x is greater than or equal to 4 (i.e. x can be 4 or any number greater than 4)
And we could express the solution to the inequality x>4 using interval notation as:
[4,∞)
Notice that, since 4 was included in the solution set, we used square brackets instead of parenthesis.
The difference between the solutions to x>4 and x≥4 in interval notation are summarized in Figure 04 below. The key takeaway here is that you use parentheses when the endpoint is a number and is not included in the solution set and square brackets when the endpoint is a number and is included in the solution set.

Figure 04: Use parentheses when the endpoint is a number and is not included in the solution set and square brackets when the endpoint is a number and is included in the solution set.
Did you notice that you only have to differentiate between parentheses and brackets when the endpoint is a number?
In the case of infinity, you will always use parentheses since ∞ is not a definitive value or a true endpoint.
Next, let’s take a look at one more inequality: x ≤ 0 as shown on the graph in Figure 05 below:

Figure 05: The inequality x≤0 (x is less than or equal to 0) on the number line.
Notice that all numbers less than 0, and including 0, are solutions to this inequality.
We could express the solution to the inequality x≤0 verbally as:
x is less than or equal to 0 (i.e. x can be 0 or any number less than 0)
And we could express the solution to the inequality x≤0 using interval notation as:
(-∞,0]
When using interval notation, we have to identify the smallest value(s) on the left side and the largest on the right side. So, in this case of x≤0, we have to state on the left side that the smallest values are approaching negative ∞ and, on the right, the largest possible value is 0 (and, since 0 is included the solution set, we have to use a square bracket).
Figure 06 below illustrates a few more examples of the solutions of inequalities expressed in interval notation. Make sure that you are comfortable with interval notation before moving forward, as it is key to learning how to find domain and range of a graph function.

Figure 06: How to find domain and range of a graph starts with understanding interval notation.
What is Domain and Range?
Domain
In algebra, the domain of a function refers to the set of all possible x-values for that function.
For example, the function y=x² has a domain of (-∞,∞). This means that the domain includes all real numbers since any number can be squared (positive, negative, or zero) without any limitations.
Range
In algebra, the range of a function refers to the set of all possible y-values for that function.
For example, the function y=x² has a range of [0,∞) because any number squared, whether positive or negative, will always be greater than or equal to zero (the result can never be negative).
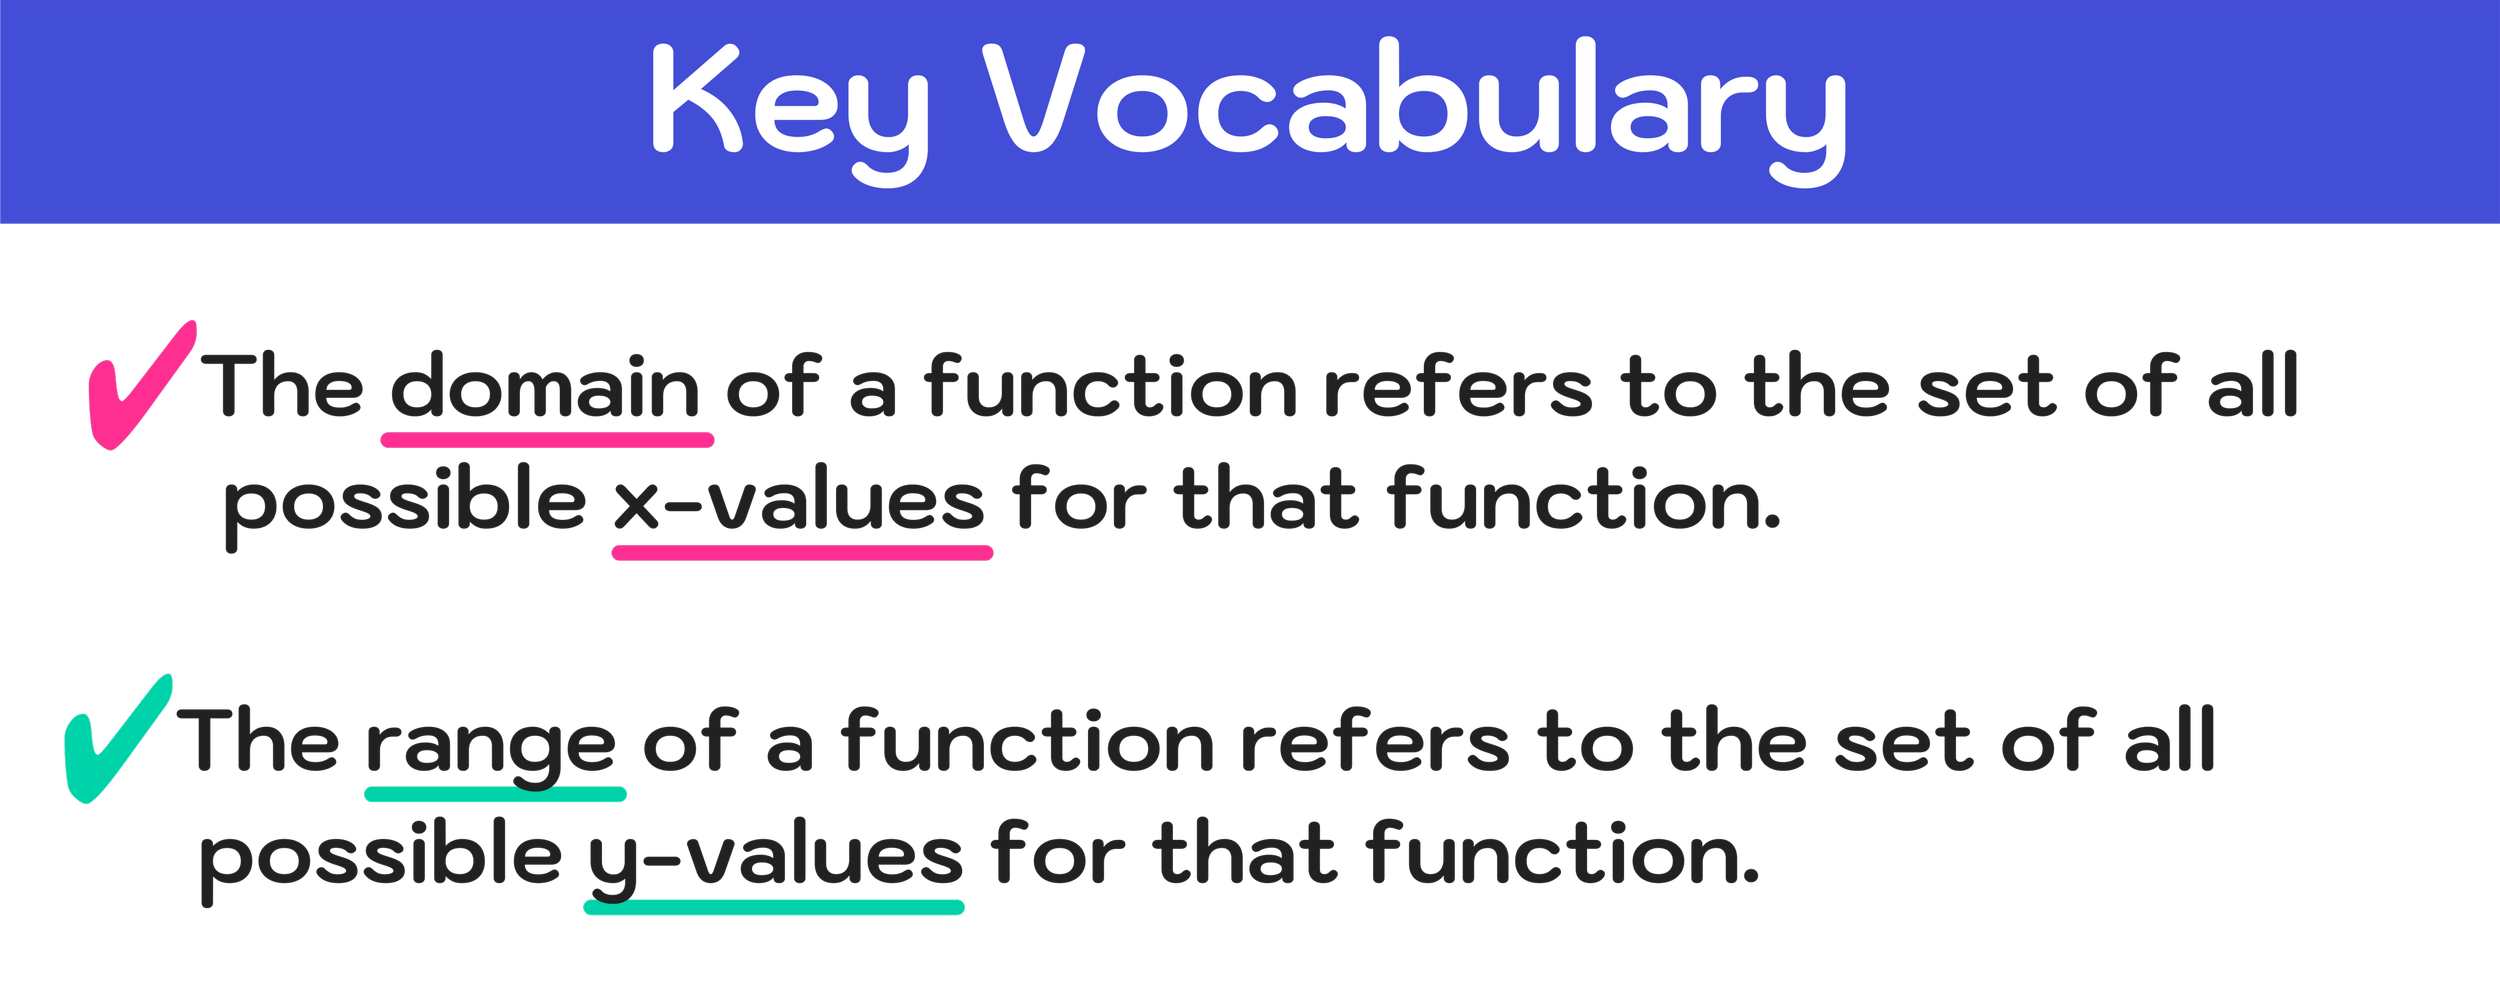
Figure 07: The domain of a function refers to the set of all possible x-values and the range refers to all possible y-values.
Now that you are familiar with interval notation and the meaning of domain and range, let’s go ahead and look at our first example.
For example #1, we will look at the graph of the function y=x². As previously stated, we already know the domain and range of y=x² are:
The domain of y=x² is (-∞,∞)
The range of y=x² is [0,∞)
Let’s see how we can verify that we are correct simply by looking at the graph of y=x².
How to Find Domain and Range of a Graph
Example #1: Find the Domain and Range of a Graph
For our first example, we are given the graph of the function f(x)=x^2 and we are tasked with finding the domain and the range (note that our answers must be in interval notation).

Figure 08: Find the domain and range of the graph of y=x^2.
Remember that the domain refers to all of the possible x-values, and the range refers to all of the possible y-values.
Let’s start with finding the domain of this graph. Notice that the graph is a parabola that extends forever on both the left and right-side of zero. This means that, as far as the x-axis is concerned, that the graph will extend forever to the left towards negative infinity and towards the right forever towards positive infinity.
What does mean? The graph will eventually cross through every possible value of x without any exceptions or limitations.
So, we can conclude that the domain of this function is (-∞,∞), as shown in Figure 09 below:

Figure 09: The domain of the graph is (-∞,∞), meaning that the graph will pass through every possible x-value.
Next, let’s find the range. Remember that the range refers to all of the possible y-values that the graph passes through.
Unlike the domain, the graph clearly will not pass through every possible y-value. The lowest y-value of this particular graph is the vertex, or turning point, of the parabola, which is at the origin.
So, the smallest possible y-value for this graph is 0 and the largest is infinity since it continues forever and ever in an upwards direction.
So, we can conclude that the range of this function is [0,∞), as shown in Figure 10 below:

Figure 10: The range of the graph is [0,∞), meaning that the graph will pass through every possible y-value that is greater than or equal to 0.
Now, we have confirmed that the function y=x^2 has a domain and range of:
Domain: (-∞,∞)
Range: [0,∞)
Now let’s move onto another example where we gain more experience with how to find domain and range of a graph.
Example #2: Find the Domain and Range of a Graph
For our next example, we have to find the domain and range of the graph of the function f(x)=-|x|.

Figure 11: How to Find the Domain and Range of a Graph Example #2
The domain of the graph refers to all of the possible x-values.
Just like the previous example, the graph will pass cross through every possible x-value without any exceptions or limitations, so we can conclude that:
Domain: (-∞,∞)
The range of the graph refers to all of the possible y-values.
Notice that this graph is similar to the graph in Example #1, except it is upside down. As far as the range is concerned, this graph has an upper limit at 0 and a lower limit at negative infinity since it extends forever and ever in a downward direction, so we can conclude that:
Range: (-∞,0]

Figure 12: The graph has a domain of (-∞,∞) and a range of (-∞,0].
In conclusion, the graph y=-|x| has the following domain and range:
Domain: (-∞,∞)
Range: [0,∞)
Are you starting to get the hang of it? Let’s continue onto the next example.
Example #3: Find the Domain and Range of a Graph
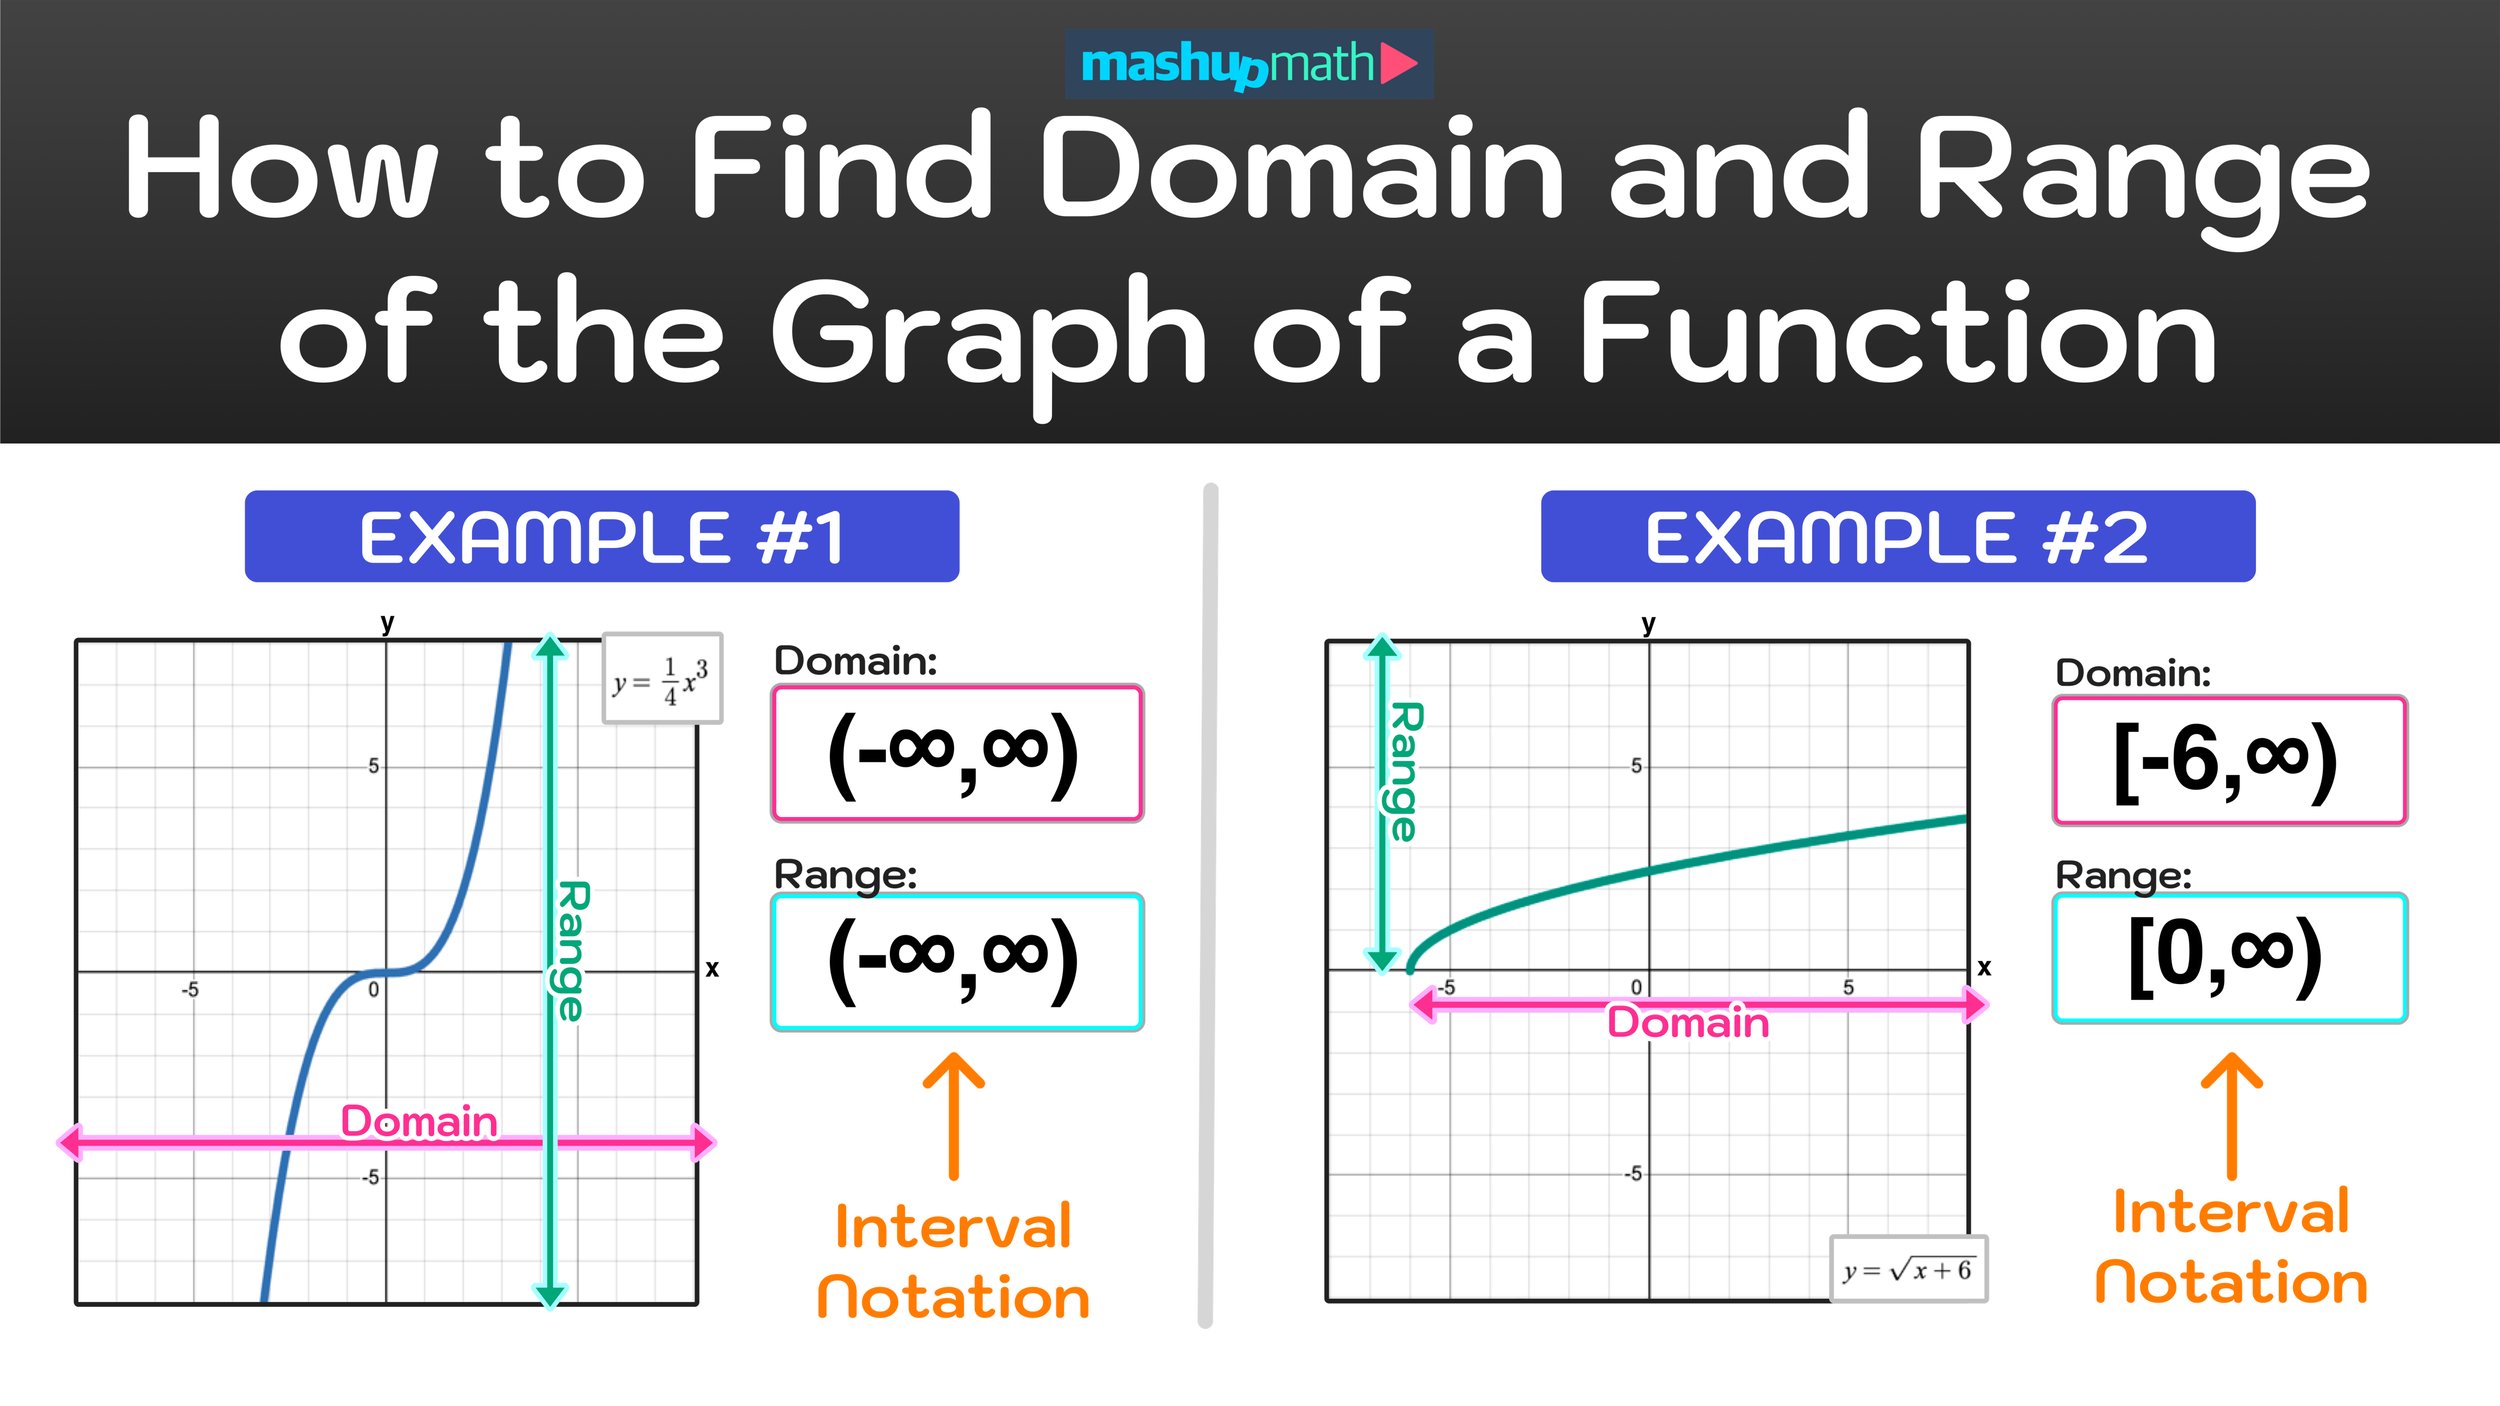
For our third example, let’s find the domain and range of the graph of f(x)=(1/4)x^3

Figure 13: How to Find Domain and Range of a Graph
Since this graph extends forever and ever in both directions left and right, we know that the domain of the graph will be all real numbers and we can conclude that:
Domain: (-∞,∞)
Similarly, the graph also extends forever and ever in both directions up and down, so we know that the range of the graph will also be all real numbers and we can conclude that:
Range: (-∞,∞)

Figure 14: Both the domain and range of the graph are (-∞,∞).
Final Answer: The domain and range of a graph with equation f(x)=(1/4)x^3 is:
Domain: (-∞,∞)
Range: [0,∞)
Example #4: Find the Domain and Range of a Graph
Moving on, we have to find the domain and range of the graph of f(x)=√(x+6)

Figure 15: How to find the domain range of a graph of f(x)=√(x+6)
The graph in our fourth example involves a function with a square root. Notice that, unlike the first three examples, the domain has some limitations.
Namely, the domain starts at -6 and extends forever to the right. So, in this case, the domain is not all real numbers. Rather, the domain is:
Domain: [-6,∞)
And, the range also has limitations and is not all real numbers. Notice that the y-values start at zero and extend forever in an upward direction, so we can conclude that the range is:
Range: [0,∞)

Figure 16: How to find the domain and range of a function graph explained.
Final Answer: The graph of the function f(x)=√(x+6) has a domain and range of:
Domain: [-6,∞)
Range: [0,∞)
Conclusion: How to Find Domain and Range of a Graph
Being able to identify the domain and range of a graph function and expressing the domain and range using interval notation are important and useful algebra skills.
In this free guide, we learned the definitions of the domain and range of a function, how to describe the domain and range of a function using interval notation, and how to find the domain and range of a graph of a function.
Key takeaways:
Domain and range are expressed using interval notation. When an endpoint is included in, we use square brackets and, when it is not, we use parentheses. Whenever -∞ or ∞ is an endpoint, we use parentheses.
Domain and range, when expressed using interval notation, always puts the smallest value/endpoint on the left and the largest value/endpoint on the right.
The domain of a function refers to the set of all possible x-values for that function and the range of a function refers to all of the possible y-values for that function.
When determining the domain of a function by looking at its graph, you need to look at its horizontal behavior (how it travels across the x-axis in both positive and negative directions).
When determining the range of a function by looking at its graph, you need to look at its vertical behavior (how it travels across the y-axis in both positive and negative directions).
That’s all there is to it! If you still confused about how to find the domain and range of a graph, we highly recommend going back and working through the practice problems again.
Keep Learning:

How to Find the Vertex of a Parabola in 3 Easy Steps
Learn how to find the coordinates of the vertex point of any parabola with this free step-by-step guide.