How to Find the Mode in Math Step-by-Step
Math Skills: How to find mode of a data set

Are you ready to learn how to find mode?
In math, it is important for students to understand different ways of measuring and describing central tendency when it comes to sets of data. One of the simplest ways to do this is a method called finding the mode, or most common number, of a given data set.
This free step-by-step guide on How to Find Mode will teach you everything you need to know about the mode of a set of numbers, how to find it, and what it represents.
You can use the links below to jump to any section of this guide, or you can work through each section in order.
Ready to get started?
Lesson Preview: How to find mode of a given data set.
What is the Mode of a Data Set?
In math, the term data set refers to a collection of values that represent some type of data.
For example, the amount of money in savings for five different students is $18, $21, $9, $13, and $21.
These dollar amounts can be expressed as a data set simply by writing the collection of numbers inside of curly brackets (separated by commas) as follows:
{18, 21, 9, 13, 21}
This scenario where we are using a data set to represent the savings of five students in illustrated in Figure 01 below.

Figure 01: How to Find Mode of a Data Set.
In math, the mode of a data set is the value that has the highest frequency. In other words, the mode is the value in the data set that is present more than any other number (i.e. the mode is the most common number).
Note that: a data set can have one mode, no mode, or multiple modes.
While finding the mode of a data set is a simple process, it is an important skill because it will help you to identify trends within a set of data and how it is distributed.
How to Find Mode
To find the mode of a data set, simply look at all of the values in the set and determine which value appears the most. Remember that a data set can have one mode, multiple modes, or no mode (we will see instances of all three scenarios in the examples below).
For example, how can we find the mode of the data set that represented student’s savings?
Remember that the data set included the following values:
{18, 21, 9, 13, 21}
In this case, notice that one value is present twice (21)), while all of the other values only occur once.
Therefore, we know that 21 is the most common number in the data set and we can conclude that:
Final Answer: The mode is 21.
The step-by-step process for how to find the mode in math are shown in Figure 02 below.

Figure 02: How to Find Mode: Carefully look for the most common value.
Now that you know what the mode of a data set represents and how to identify the mode, you are ready to work through several problems where you will gain more experience with identifying the mode of a given set of data.
How to Find the Mode Examples
How to Find the Mode Example #1
Example: What is the mode of the data set?
Data Set: 5, 2, 8, 2, 7, 3, 2
Remember that the mode of a data set is the value with the highest frequency (i.e. the value that occurs the most times).
Given the data set above, only one value occurs more than once, and that value is 2 (which occurs 3 times). So, we can conclude that the data set has a mode of 2.
Final Answer: The mode is 2.
Notice that the data set in this example has one, and only one, mode. Figure 03 below illustrates how to find the mode for this first example.

Figure 03: How to Find Mode of a Data Set.
Now that we have solved this first example, we can see that determining the mode of a given data set is relatively easy to do.
However, there are a few nuances to finding the mode as you will see in the next few examples.
How to Find Mode Example #2
Example: What is the mode of the data set?
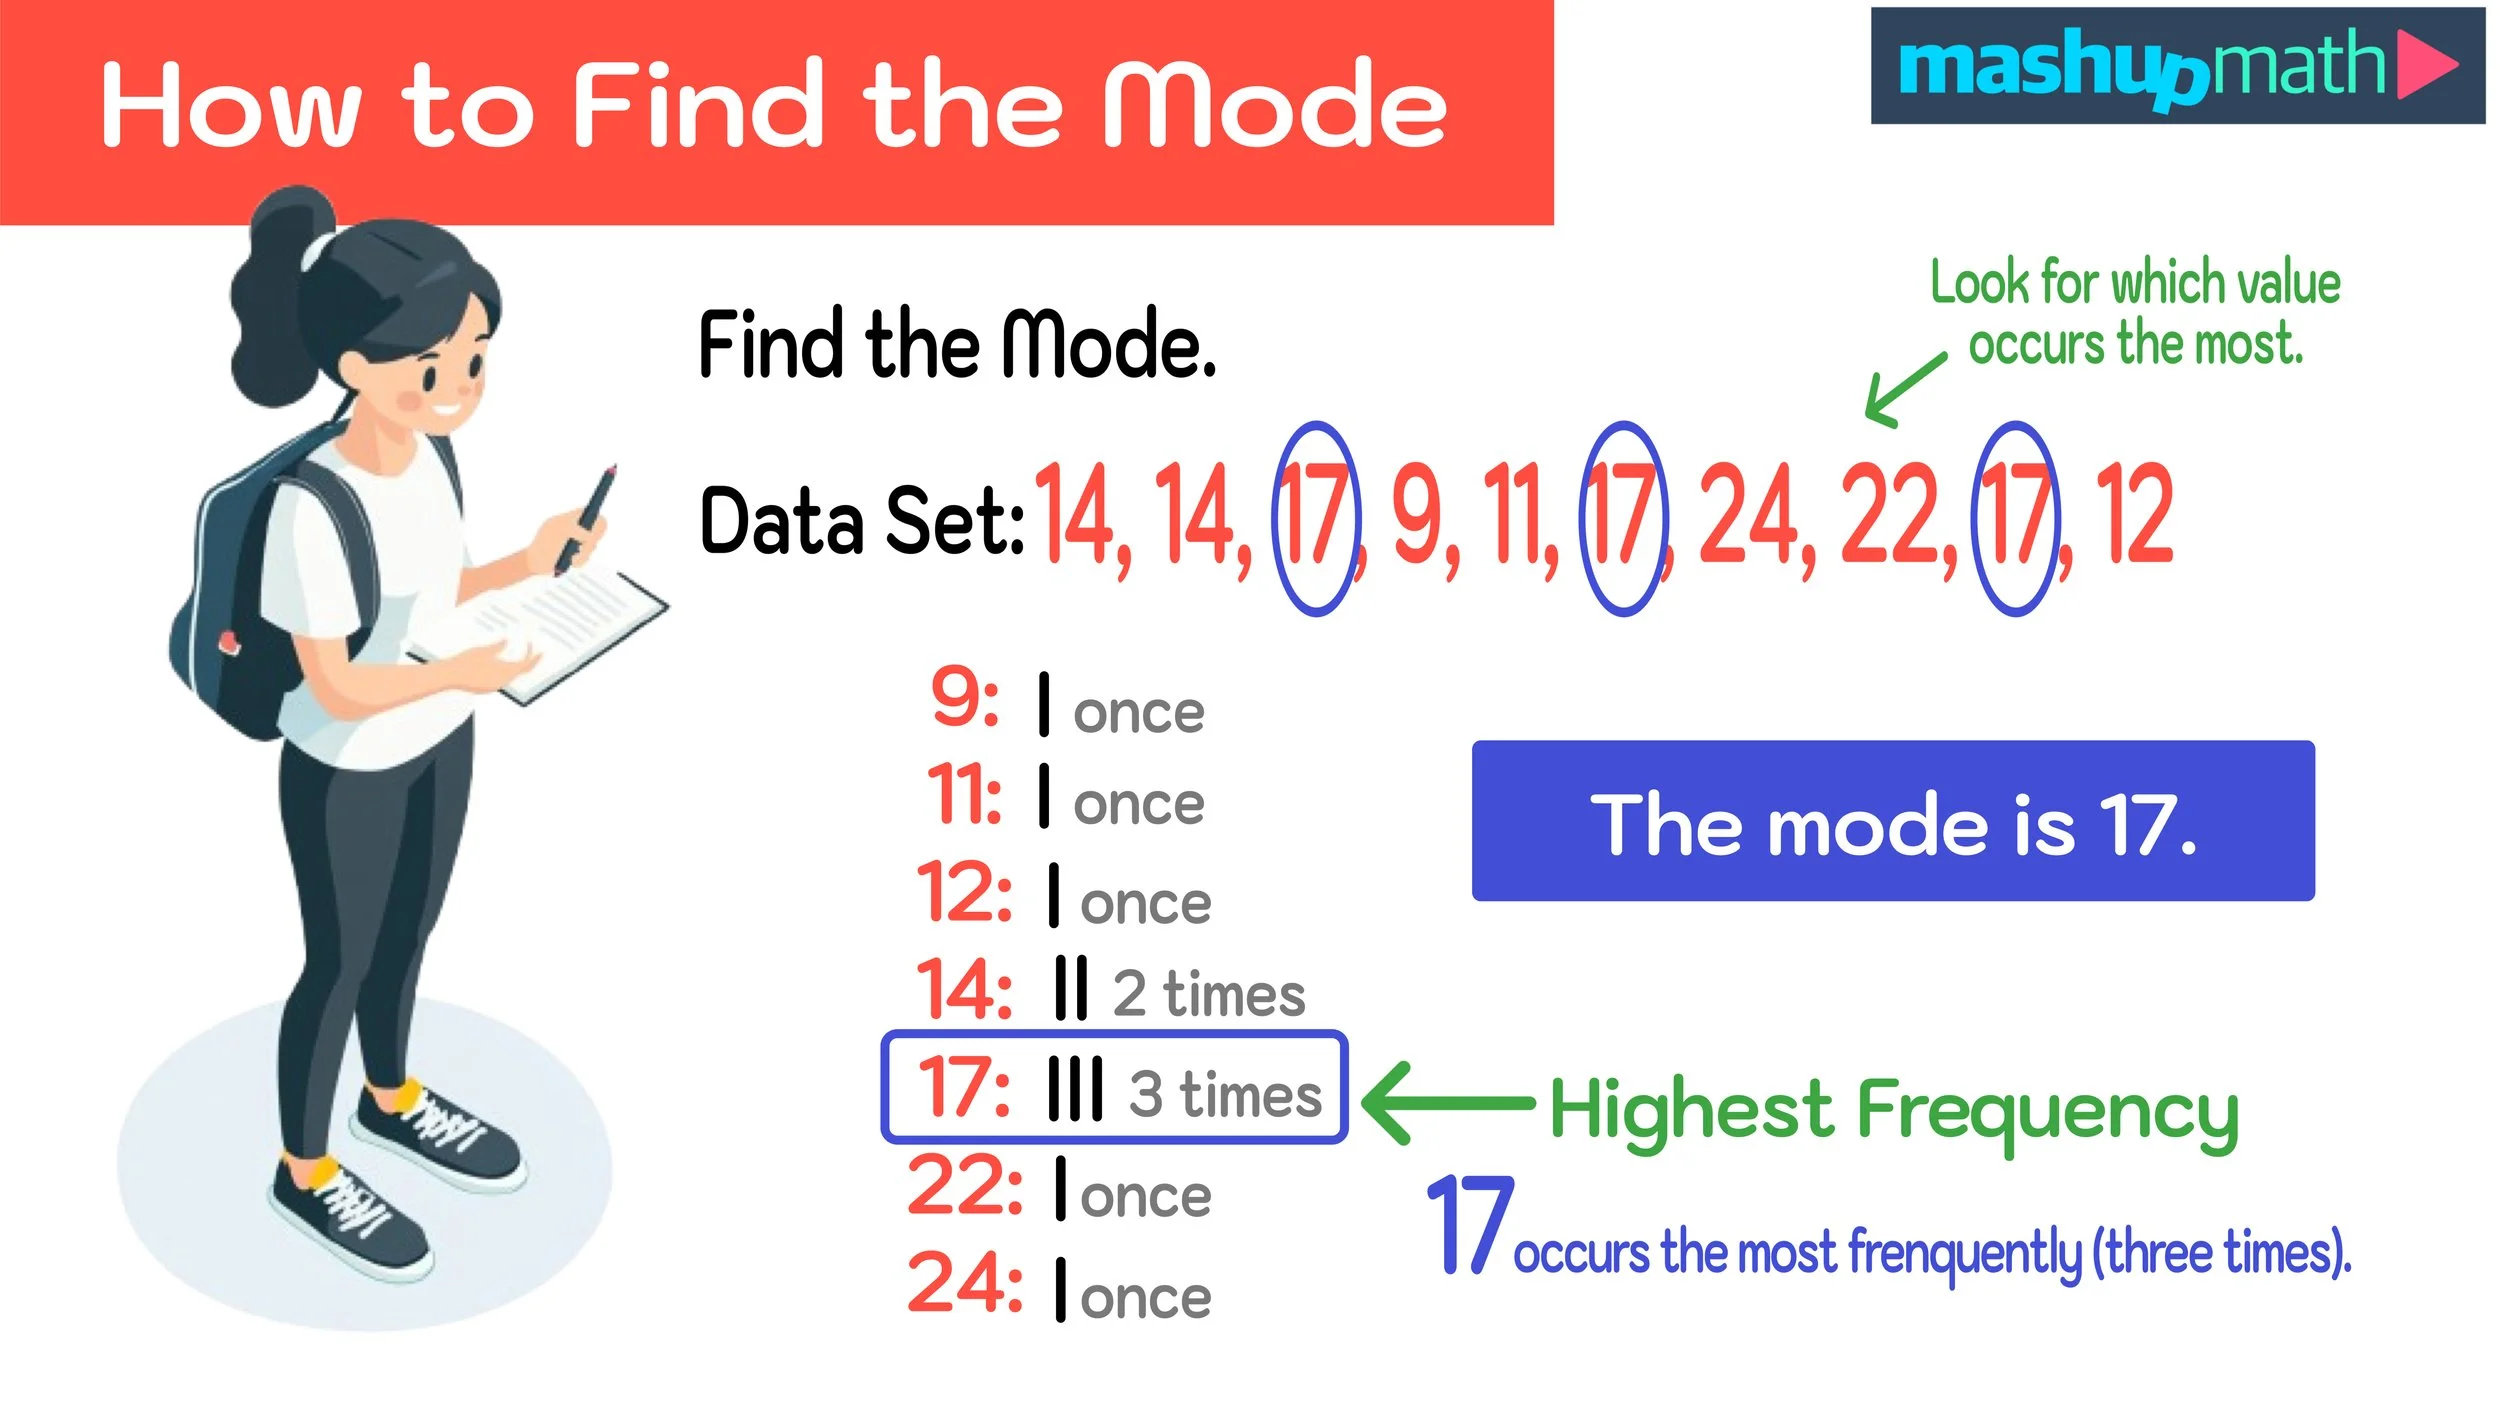
Data Set: 14, 14, 17, 9, 11, 17, 24, 22, 17, 12
For this next example, it may be tempting to say that the mode of the data set is 14 since 14 occurs more than once. However, this is actually not the case. While it is true that 14 occurs twice in this data set, there is a number that occurs more than twice: 17 occurs 3 times.
Since 17 occurs more than any other number (it occurs 3 times), we can conclude that:
Final Answer: The mode is 17.
Just like the previous example, this data set has only one mode.

Figure 04: How to Find Mode in Math
How to Find Mode Example #3
Example: What is the mode of the data set?
Data Set: 5, 11, 9, 8, 9, 9, 11, 11, 7, 5, 11, 10, 9, 3, 11, 12
Notice that the given data set in this example is much larger than the data sets from the first two examples. In this case, we have several numbers that occur multiple times, so it would be helpful to make a quick tally chart for each value so we can accurately determine which value in this data set occurs the most:
3: once
5: 2 times
7: once
8: once
9: 4 times
10: once
11: 5 times
12: once
Now that we have logged the frequency of each value in the data set, we can see that the number with the highest frequency is 11 (it occurs 5 times).
Final Answer: The mode is 11.
Again, the data set in this example has only one mode.

Figure 05: How to Find Mode Explained.
How to Find Mode Example #4
Example: What is the mode of the data set?
Data Set: 5, 5, 5, 7, 7, 9, 9, 9, 7, 7, 9
Just like the last example, it is difficult to determine the mode of this data set simply by looking at it, so we will again create a tally chart to keep track of the frequency of each value:
5: 3 times
7: 4 times
9: 4 times
Notice that this data set does not have one single value that occurs more than any other value. In fact, there is a “tie” in this case, where both 7 and 9 occur 4 times each in the data set.
In cases such as this, the data set can be considered multimodal, meaning that it has more than one mode (in this case, the data set has 2 modes).
Final Answer: The mode is 7 and 9.

Figure 06: Example of a multimodal data set (i.e. a data set that has more than one mode).
How to Find Mode Example #5
Example: What is the mode of the data set?
Data Set: 13, 0, 24, 83, 81, 55, 16, 42, 22
For this final example, we have a data set with nine values. We can track the frequency of each value as follows:
0: once
13: once
16: once
22: once
24: once
42: once
55: once
81: once
83: once
Notice that each value in the data set only occurs once. In cases like this, we have a data set with no mode.
Final Answer: There is no mode.

Figure 07: Example of a data set that has no mode.
Conclusion: How to Find Mode
Understanding how to find the mode in math is a simple, yet important skill that will help you analyze and draw conclusions about sets of data.
In math, the mode of a data set is the value with the highest frequency (i.e. the value that occurs the most in the data set).
There are three ways to classify the mode of a data set:
One Mode: There is one value that occurs more than any other value in the data set.
Multimodal: There is more than one value that occurs the most (i.e. there is a “tie” for the highest frequency).
No Mode: Each value in the data set occurs only once.
With these nuances in mind, determining the mode of a data set is a pretty simple skill that all students can master with some study and practice.