Are you looking for strategies to help your kids understand equivalent fractions this school year?
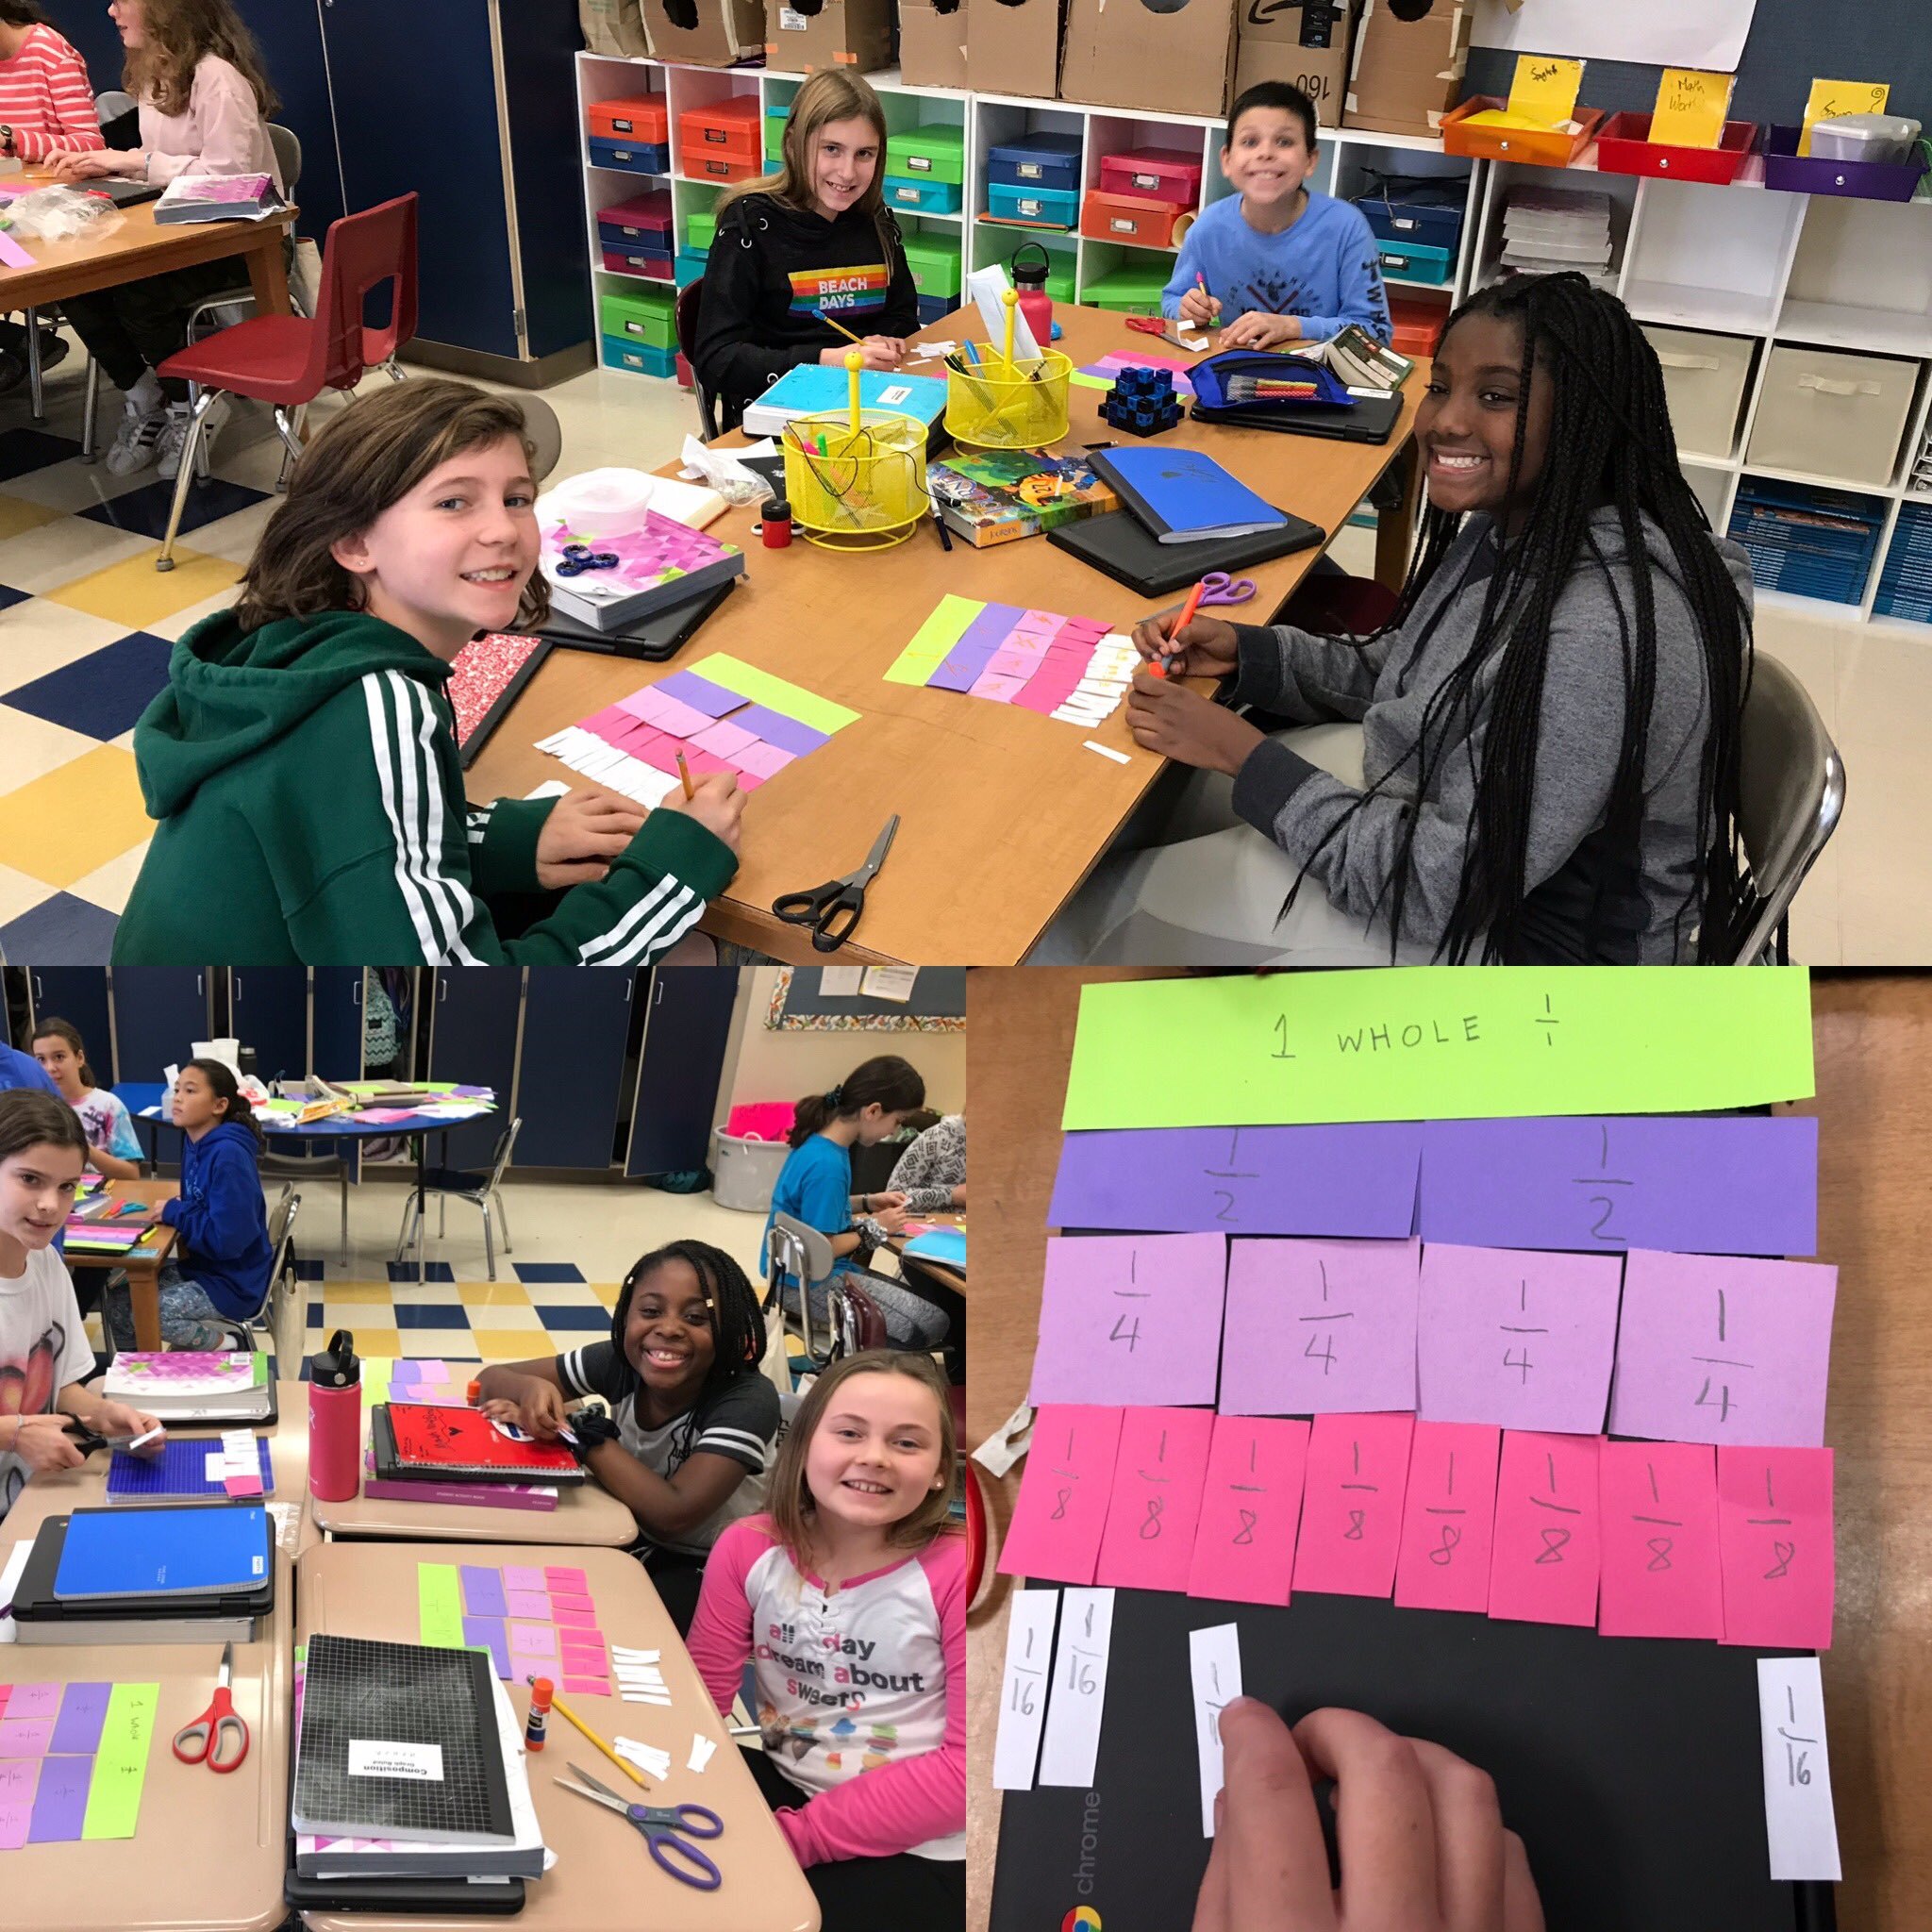
Creating fraction kits is a great way to get your kids exploring equivalent fractions and acquiring a deep, conceptual understanding of the topic.
The video below demonstrates how to create a fraction kit; it was designed to serve as a follow-along activity:
Materials: construction paper, markers, scissors, and a ruler.
Looking for the corresponding lesson guide? click here to download yours
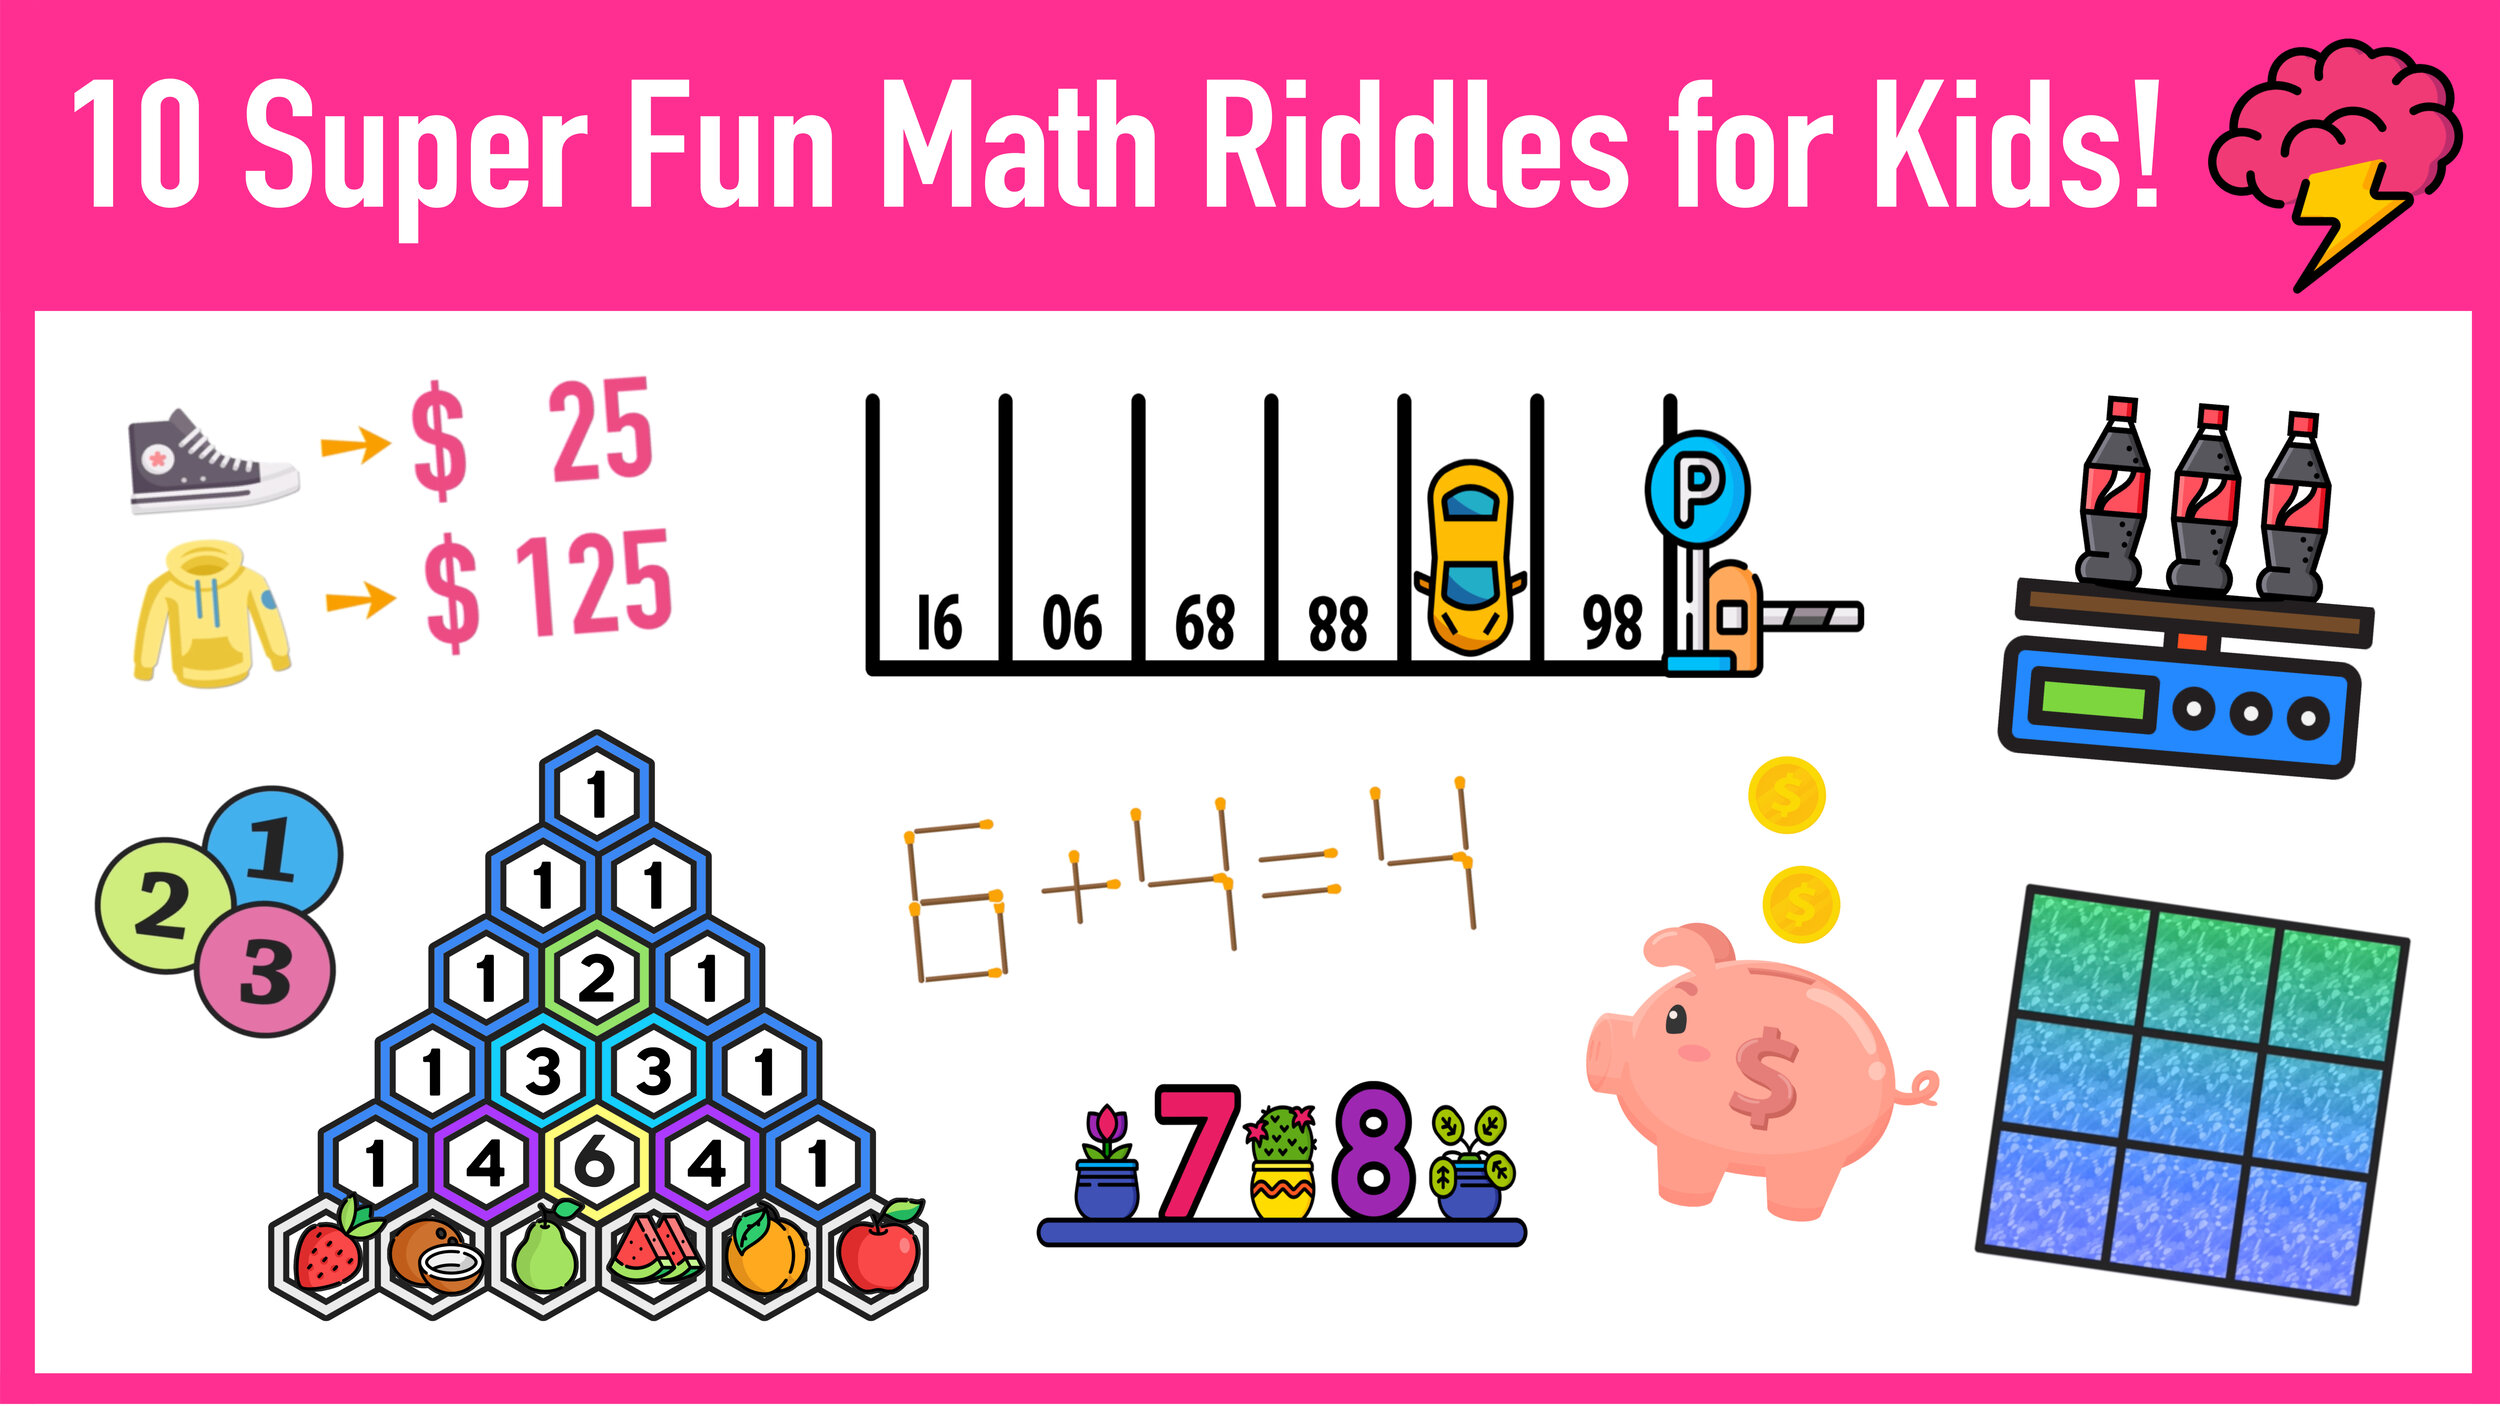
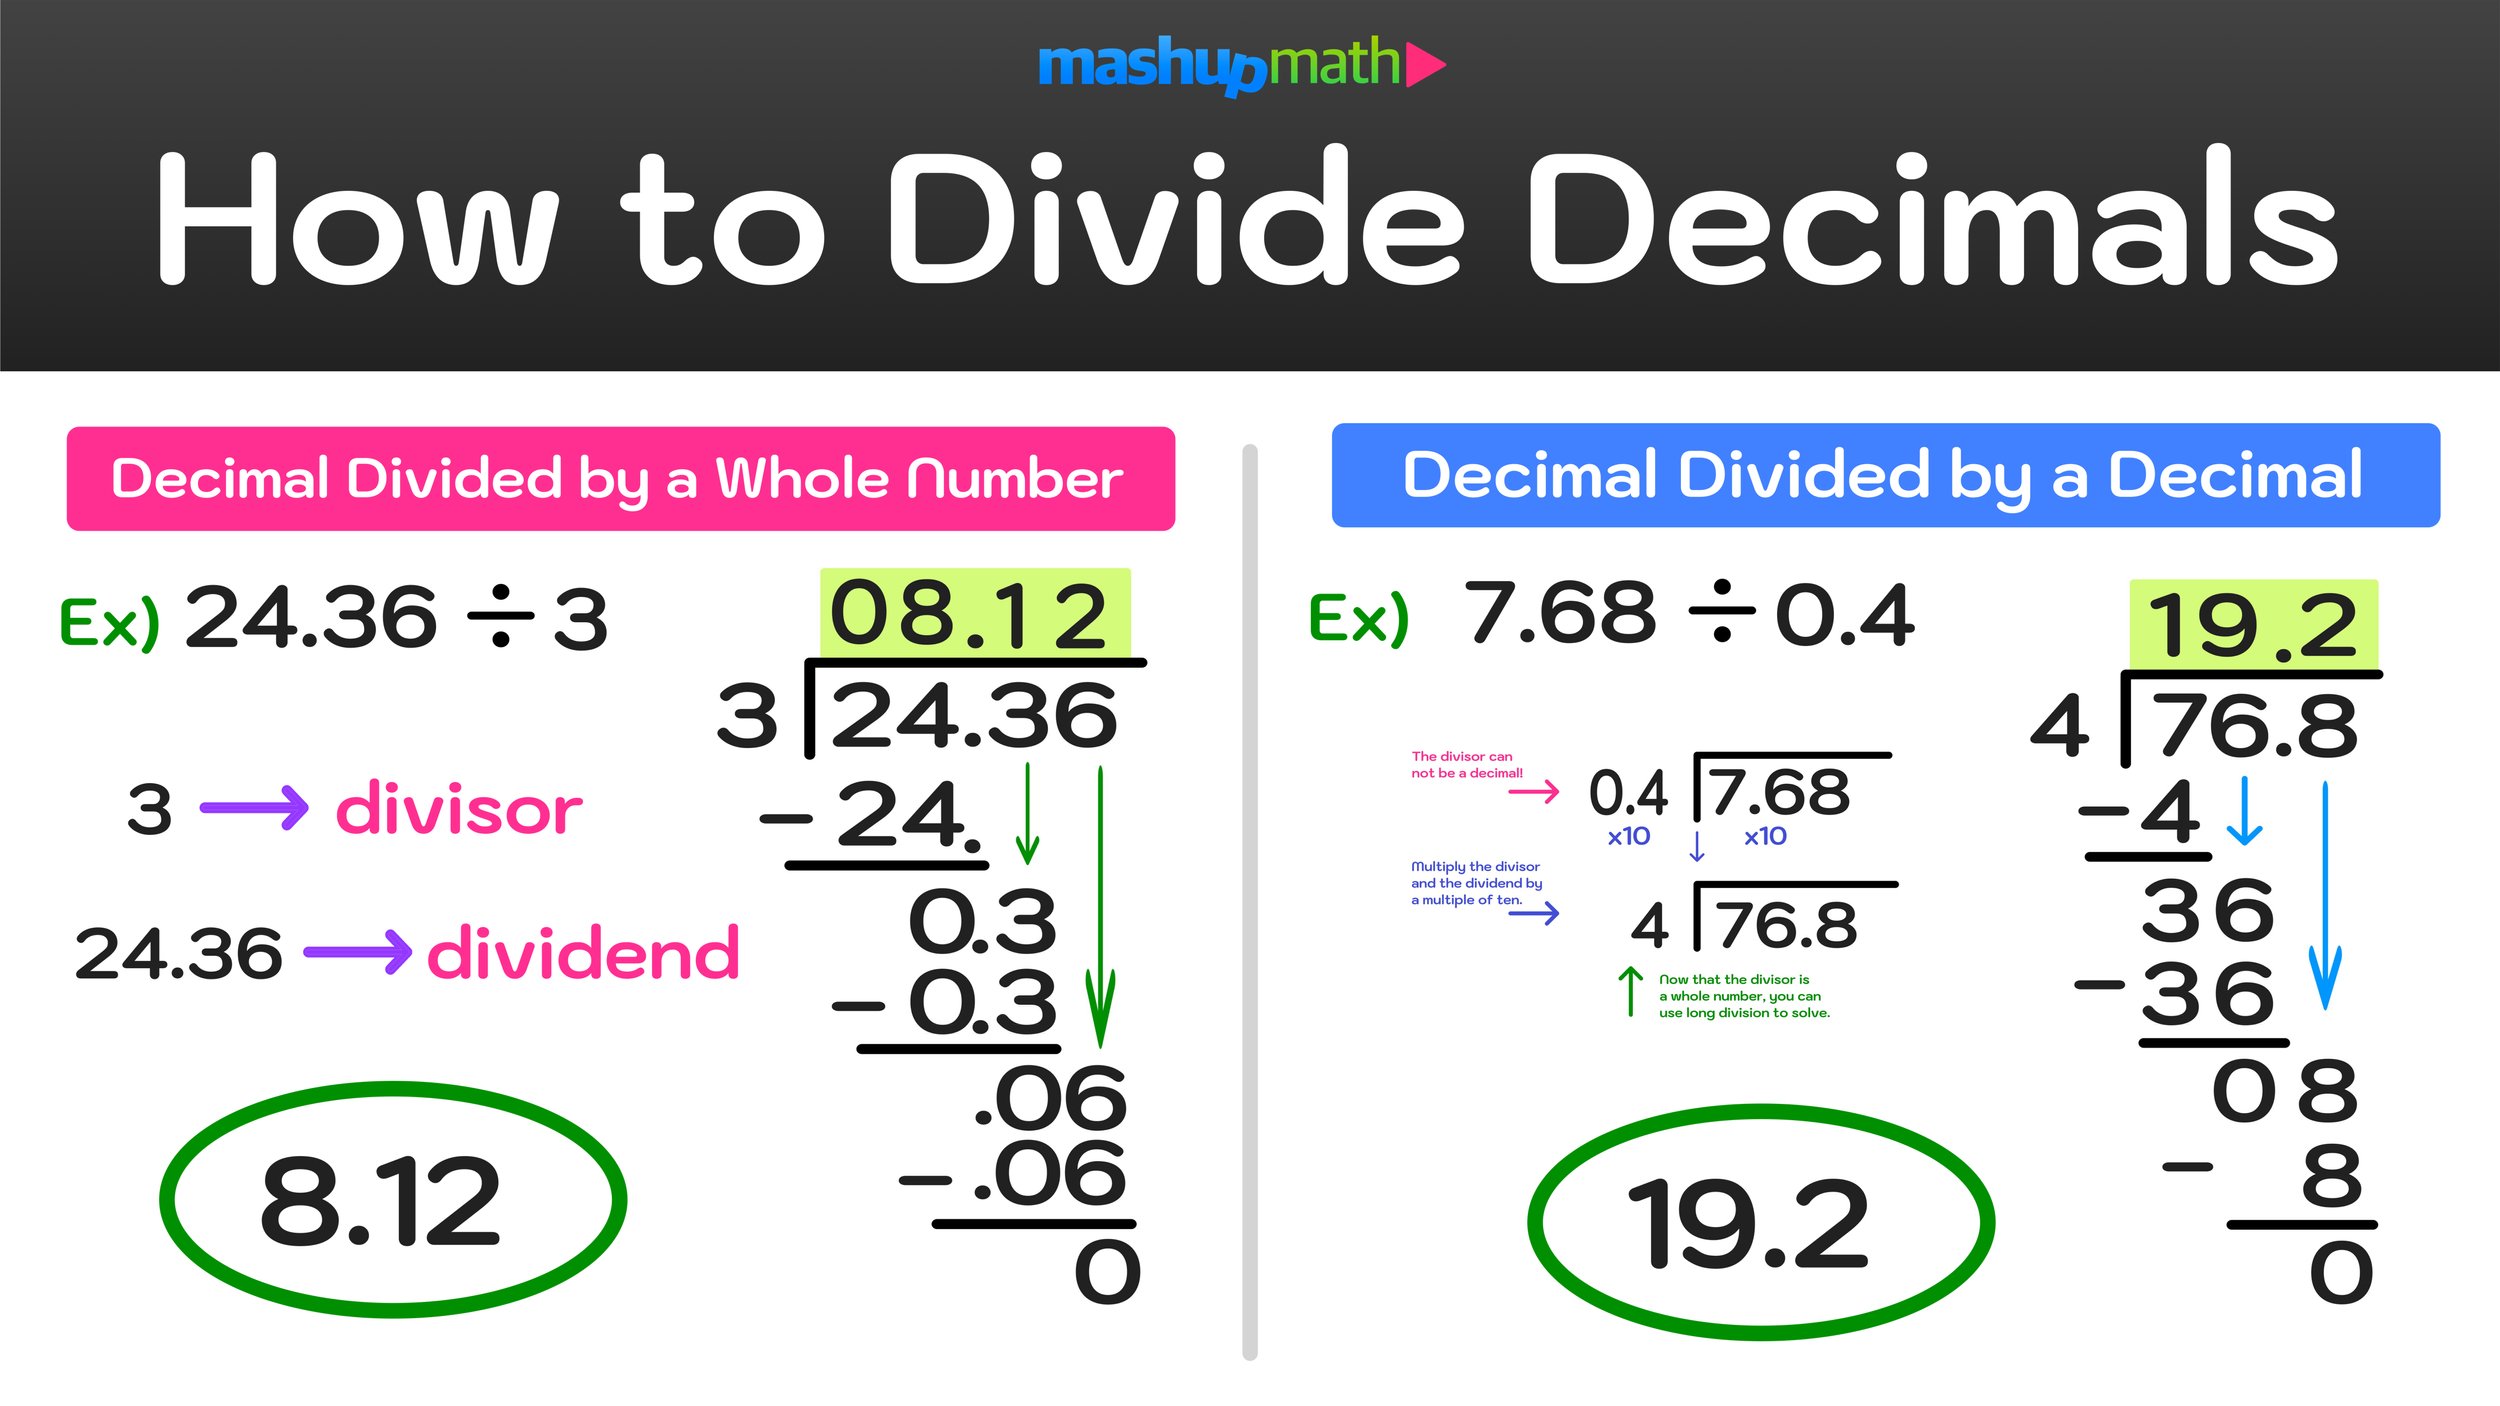
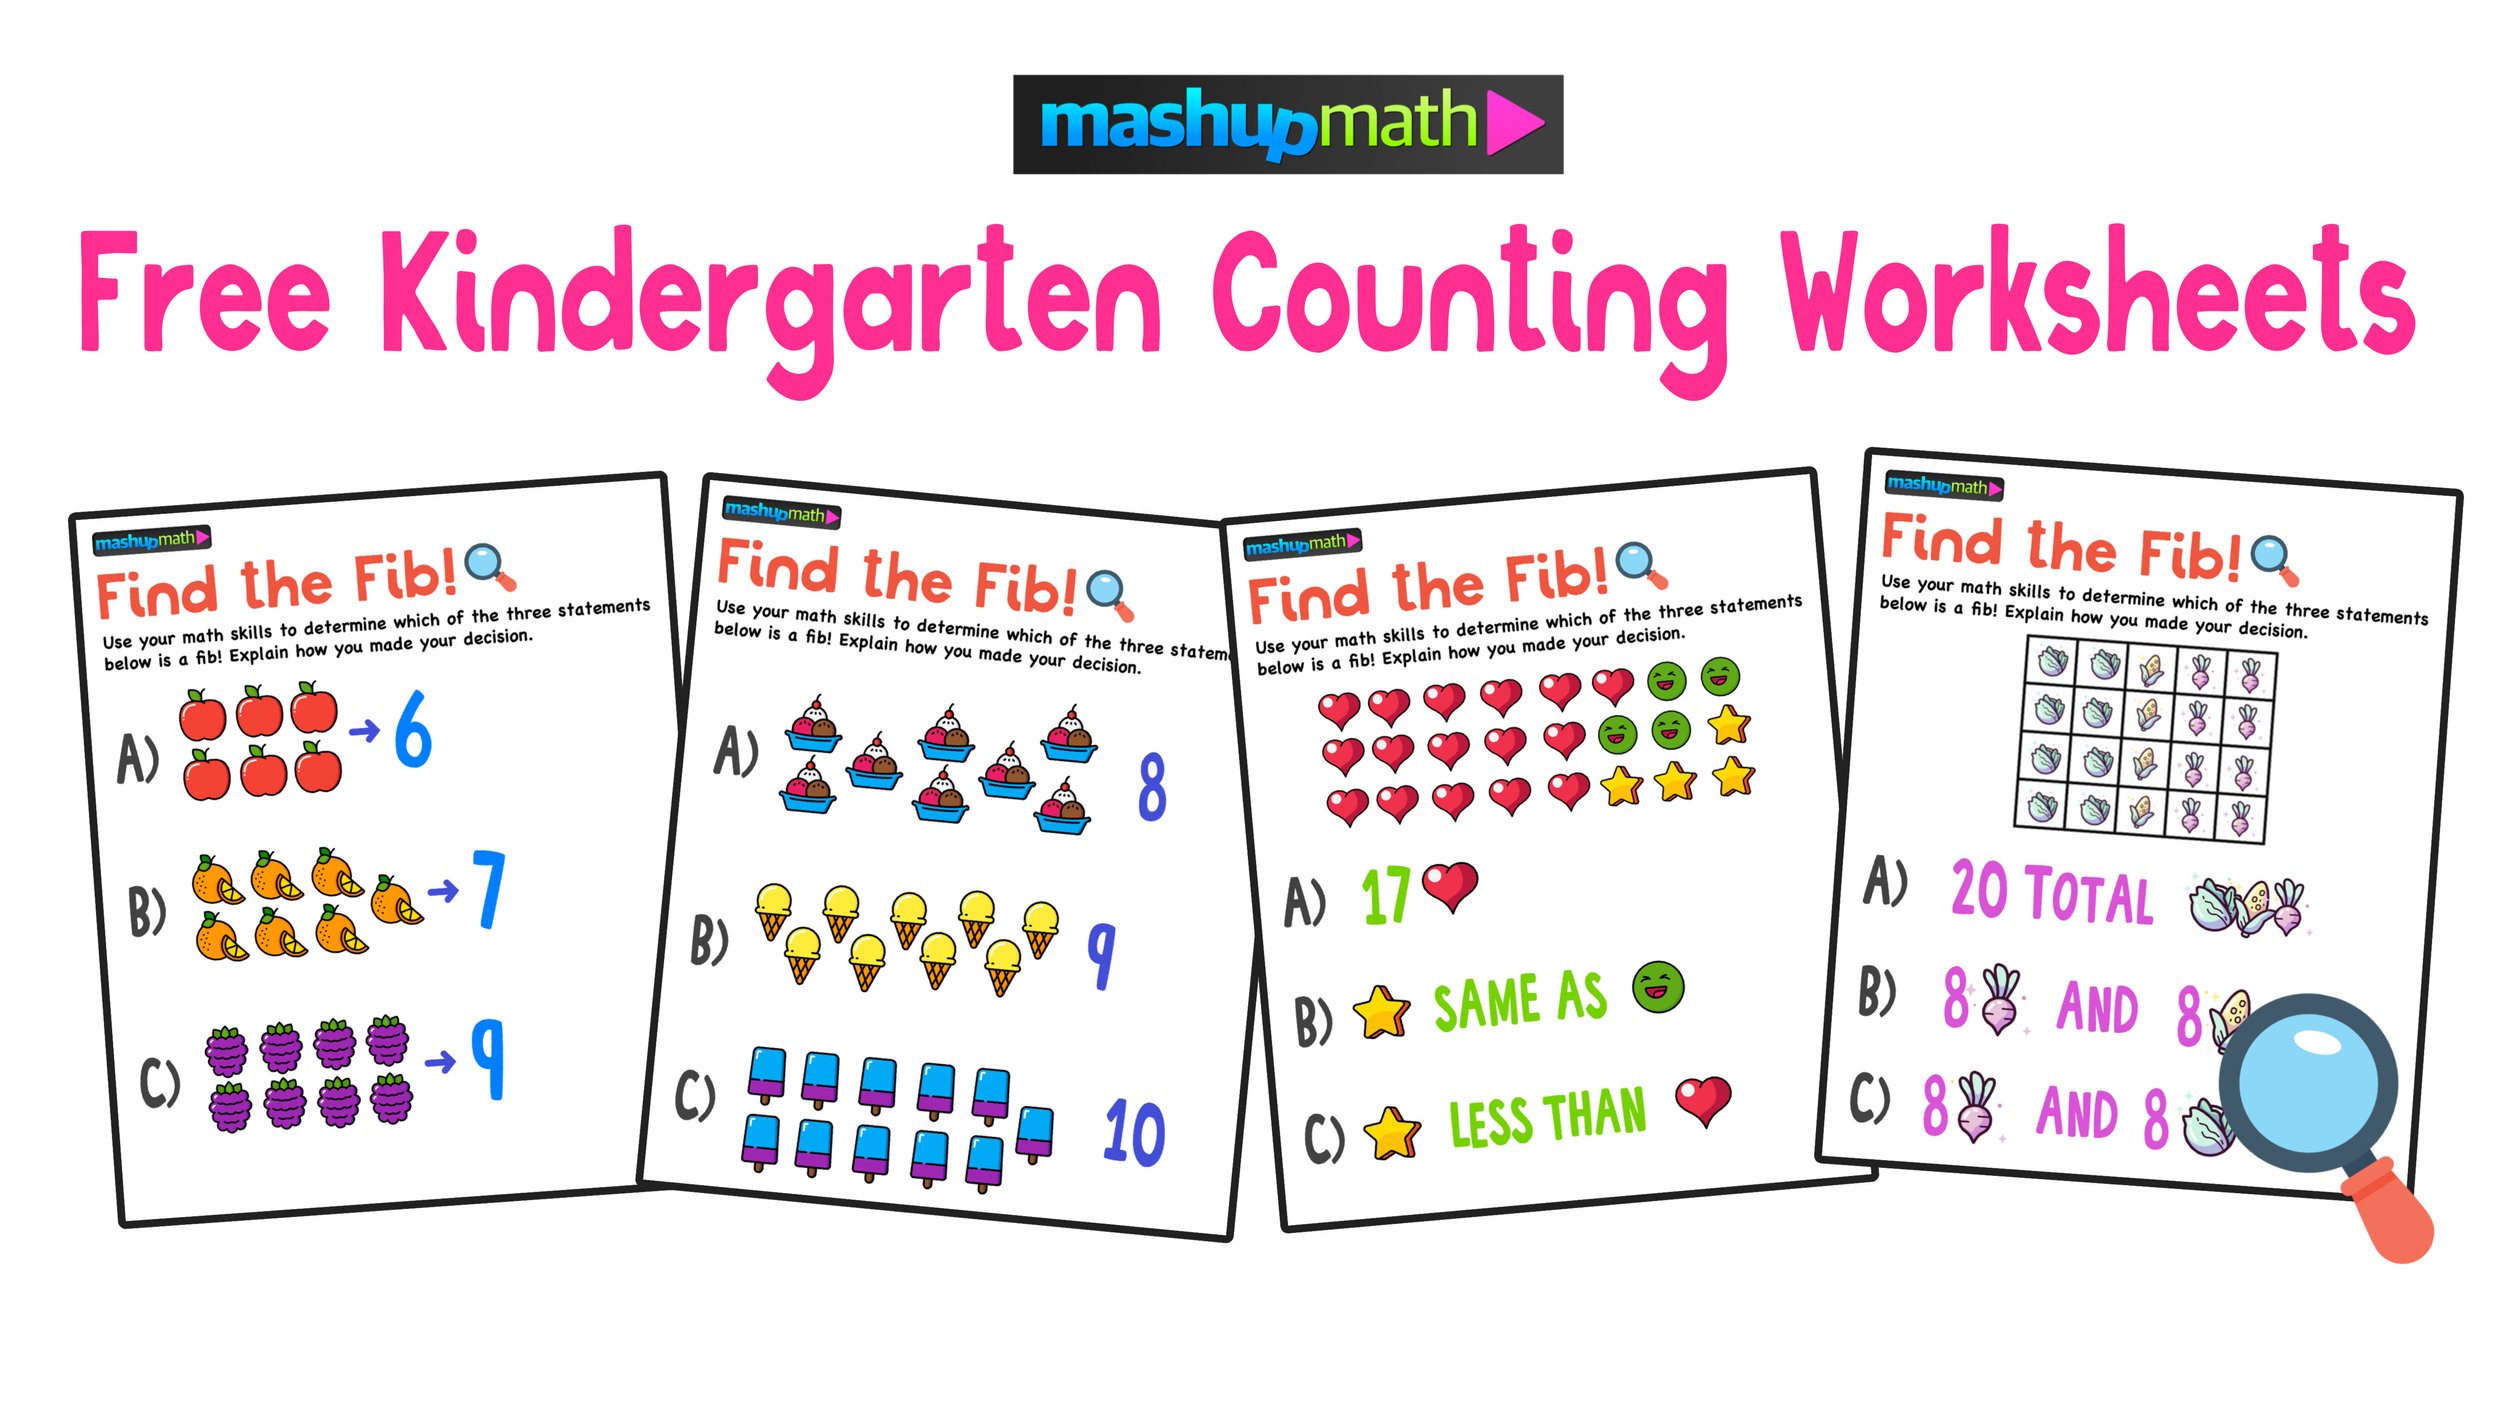
And here are some great links to more fun math activities:
“I always look forward to getting my Mashup Math newsletter email every week. I love the free activities!” -Christina R., 5th Grade Math Teacher, Dallas, TX
Do YOU want free math resources, lesson activities, and puzzles and games for grades 1-8 in your inbox every week? Join our mailing list and start getting tons of free stuff (including a free PDF workbook)!

Check Out These Posts on What’s Trending in Math Education: