How to Find the Volume of a Cube

Comment

How to Find the Volume of a Cube

VolumeCube.jpg

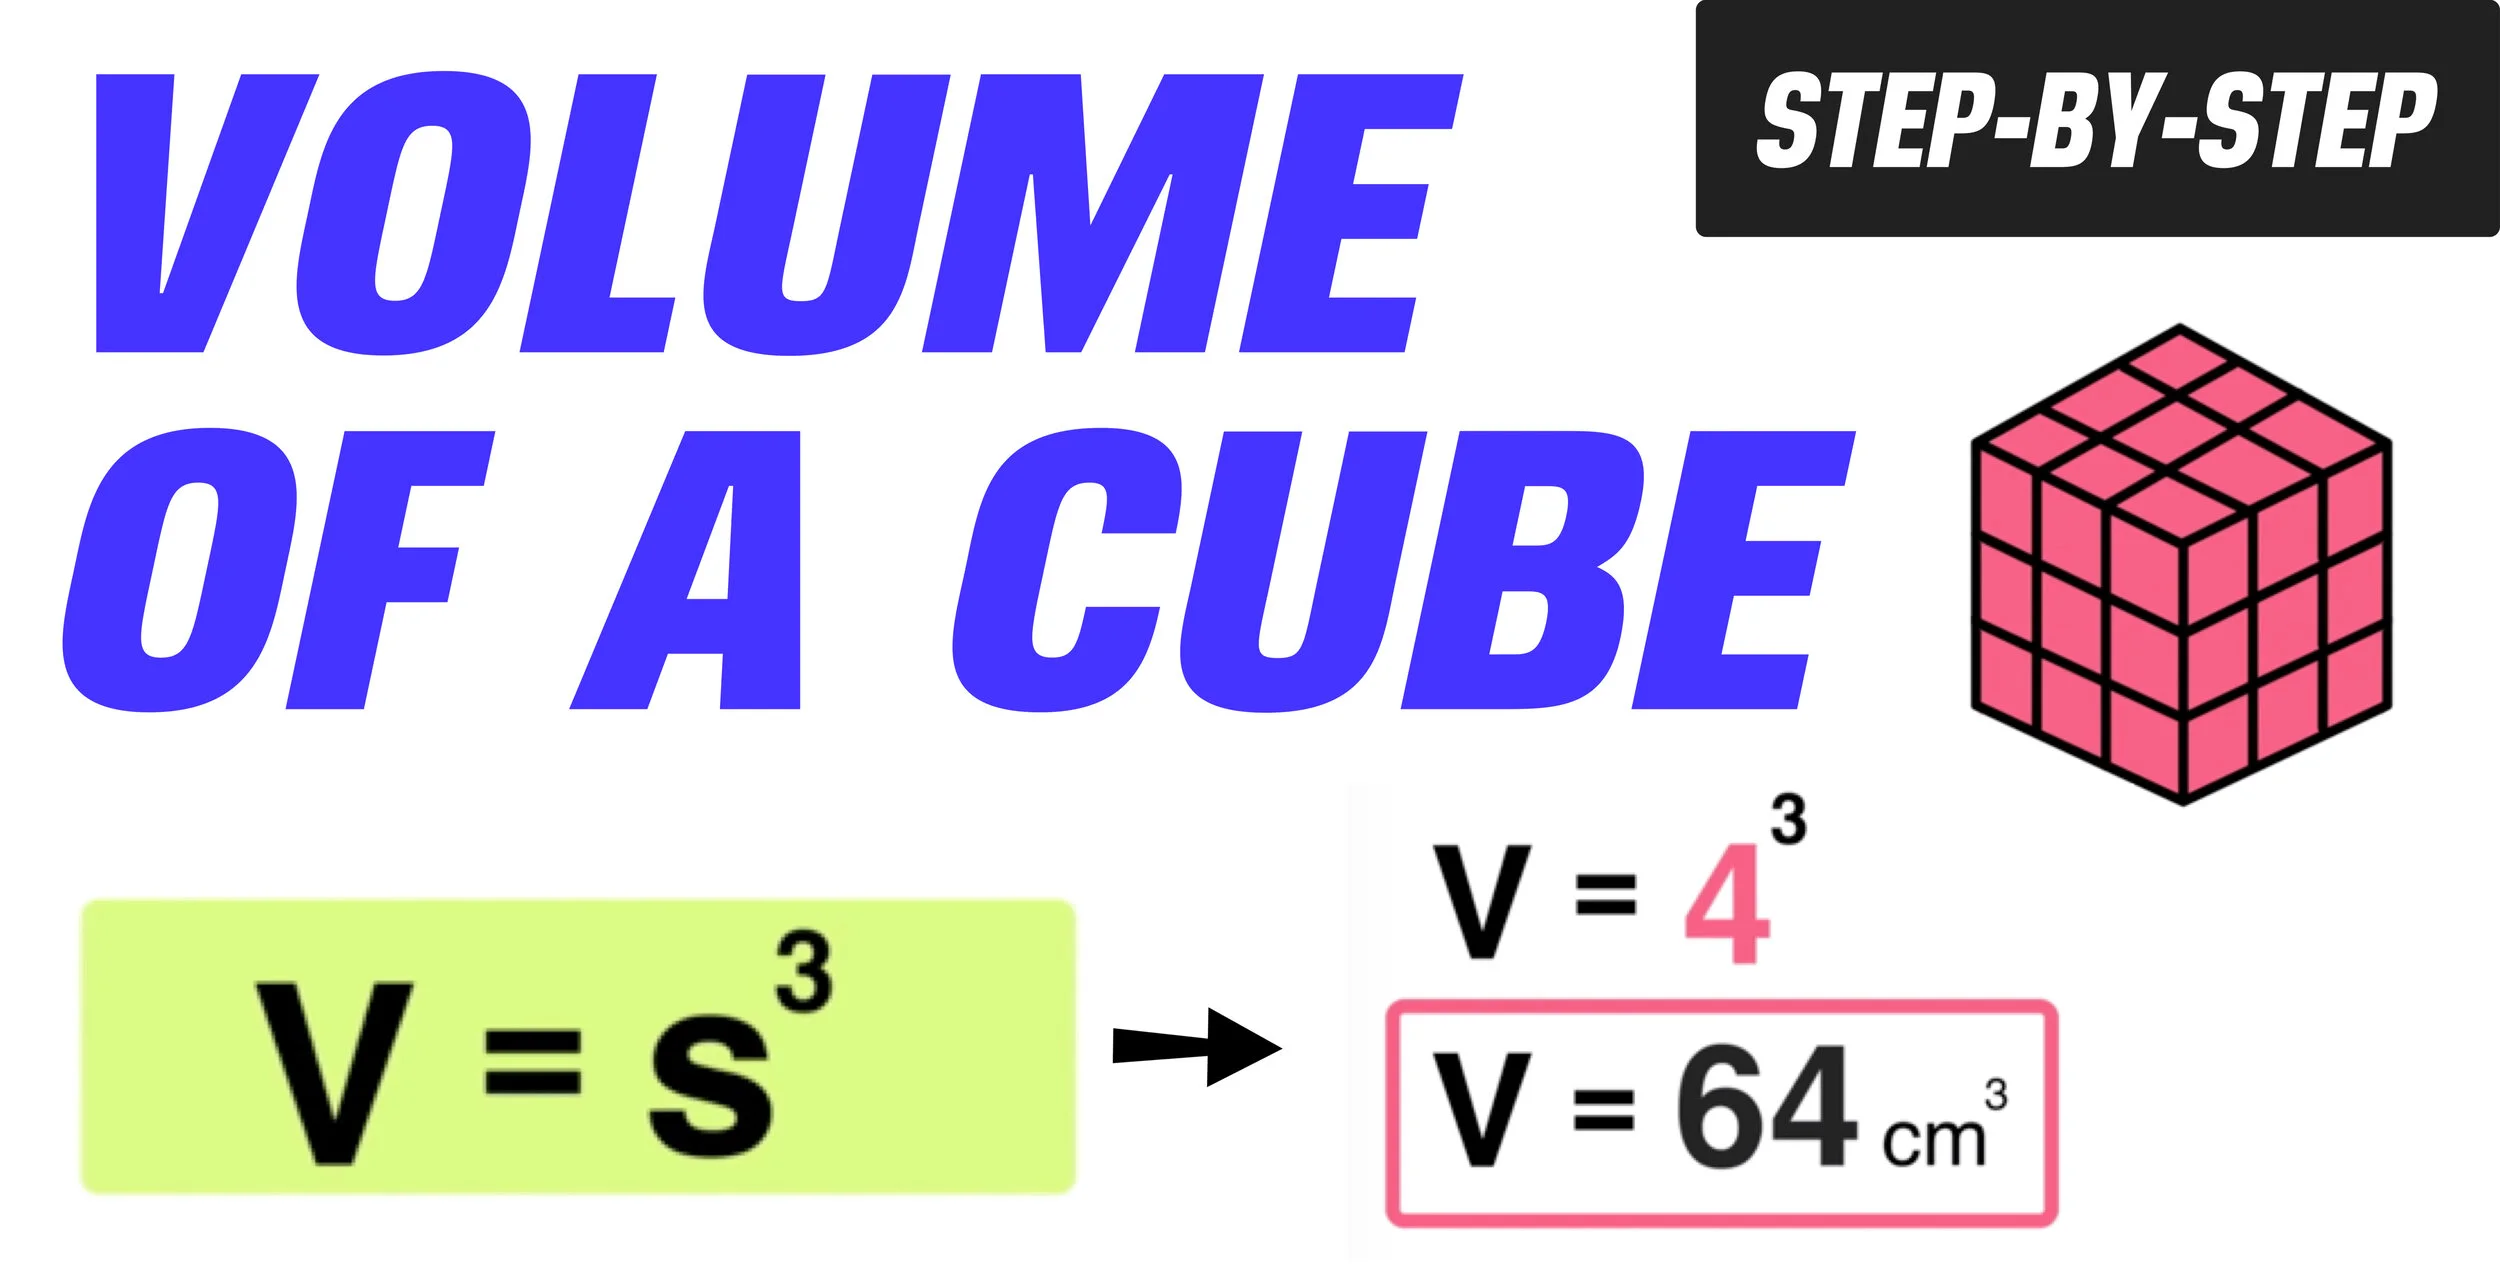
How to Find the Volume of a Cube in 3 Easy Steps

Understanding how to find the volume of a cube and how to use the volume of a cube formula is an important and useful mathematics and, more commonly geometry, skill that is relatively simple and easy to do as long as you can follow the 3 easy steps that will be outlined in this lesson.

 This free How to Find the Volume of a Cube step-by-step guide will teach you an easy method for finding the volume of a cube using the volume of a cube formula. By learning this skill, you will be able to solve any problems that call on you to find the volume of a cube (or a rectangular cube) involving any type of units.

This lesson also shares a free volume of a cube calculator that you can use to quickly input values and find the volume of a cube with just one click.

But before you learn the 3 steps for finding the volume of a cube, we will do a quick review of key vocabulary and definitions related to this topic.

What is a cube in math?

Definition: A cube is a box-shaped three-dimensional figure that has six equal and identical square faces.

The key word in this definition is equal. Unlike a rectangular prism, all of the faces of a cube are squares whose side lengths, also known as edges, have the same length.

Note that there is no difference between the term cube and rectangular cube. They both mean the same thing!

Snip20210930_16.png

What is the volume of a cube?

Definition: The volume of a cube refers to the number of unit cubes it would take to completely fill the inside of the figure.

The key word in the definition is inside, since volume refers to how much space is inside of the figure.

Volume is always expressed in cubic units.

giphy.gif
 

Volume of a Cube Formula

Before we work through a few practice problems, you need to be familiar with cube volume formula, which states that the volume of a cube is equal to the value of the side lengths, s, raised to the third power (also known as cubed).

 So, if you know the length of one of the sides (also known as edges), all that you have to do raise that value to the third power to find the volume.

 Again, remember that volume is measured in cubic units and that your final answer should always include the units.

Formula Reference:

Snip20210930_20.png
 

Now that you are familiar with the formula for finding the volume of a cube, you can use the following 3-step method to solve the practice problems below:

Step 1: Identify the value of s, the edge length of the cube

Step 2: Substitute that value for s into the volume of a cube formula

Step 3: Solve and express your answer in cubic units


Example #1: Find the Volume of the Cube

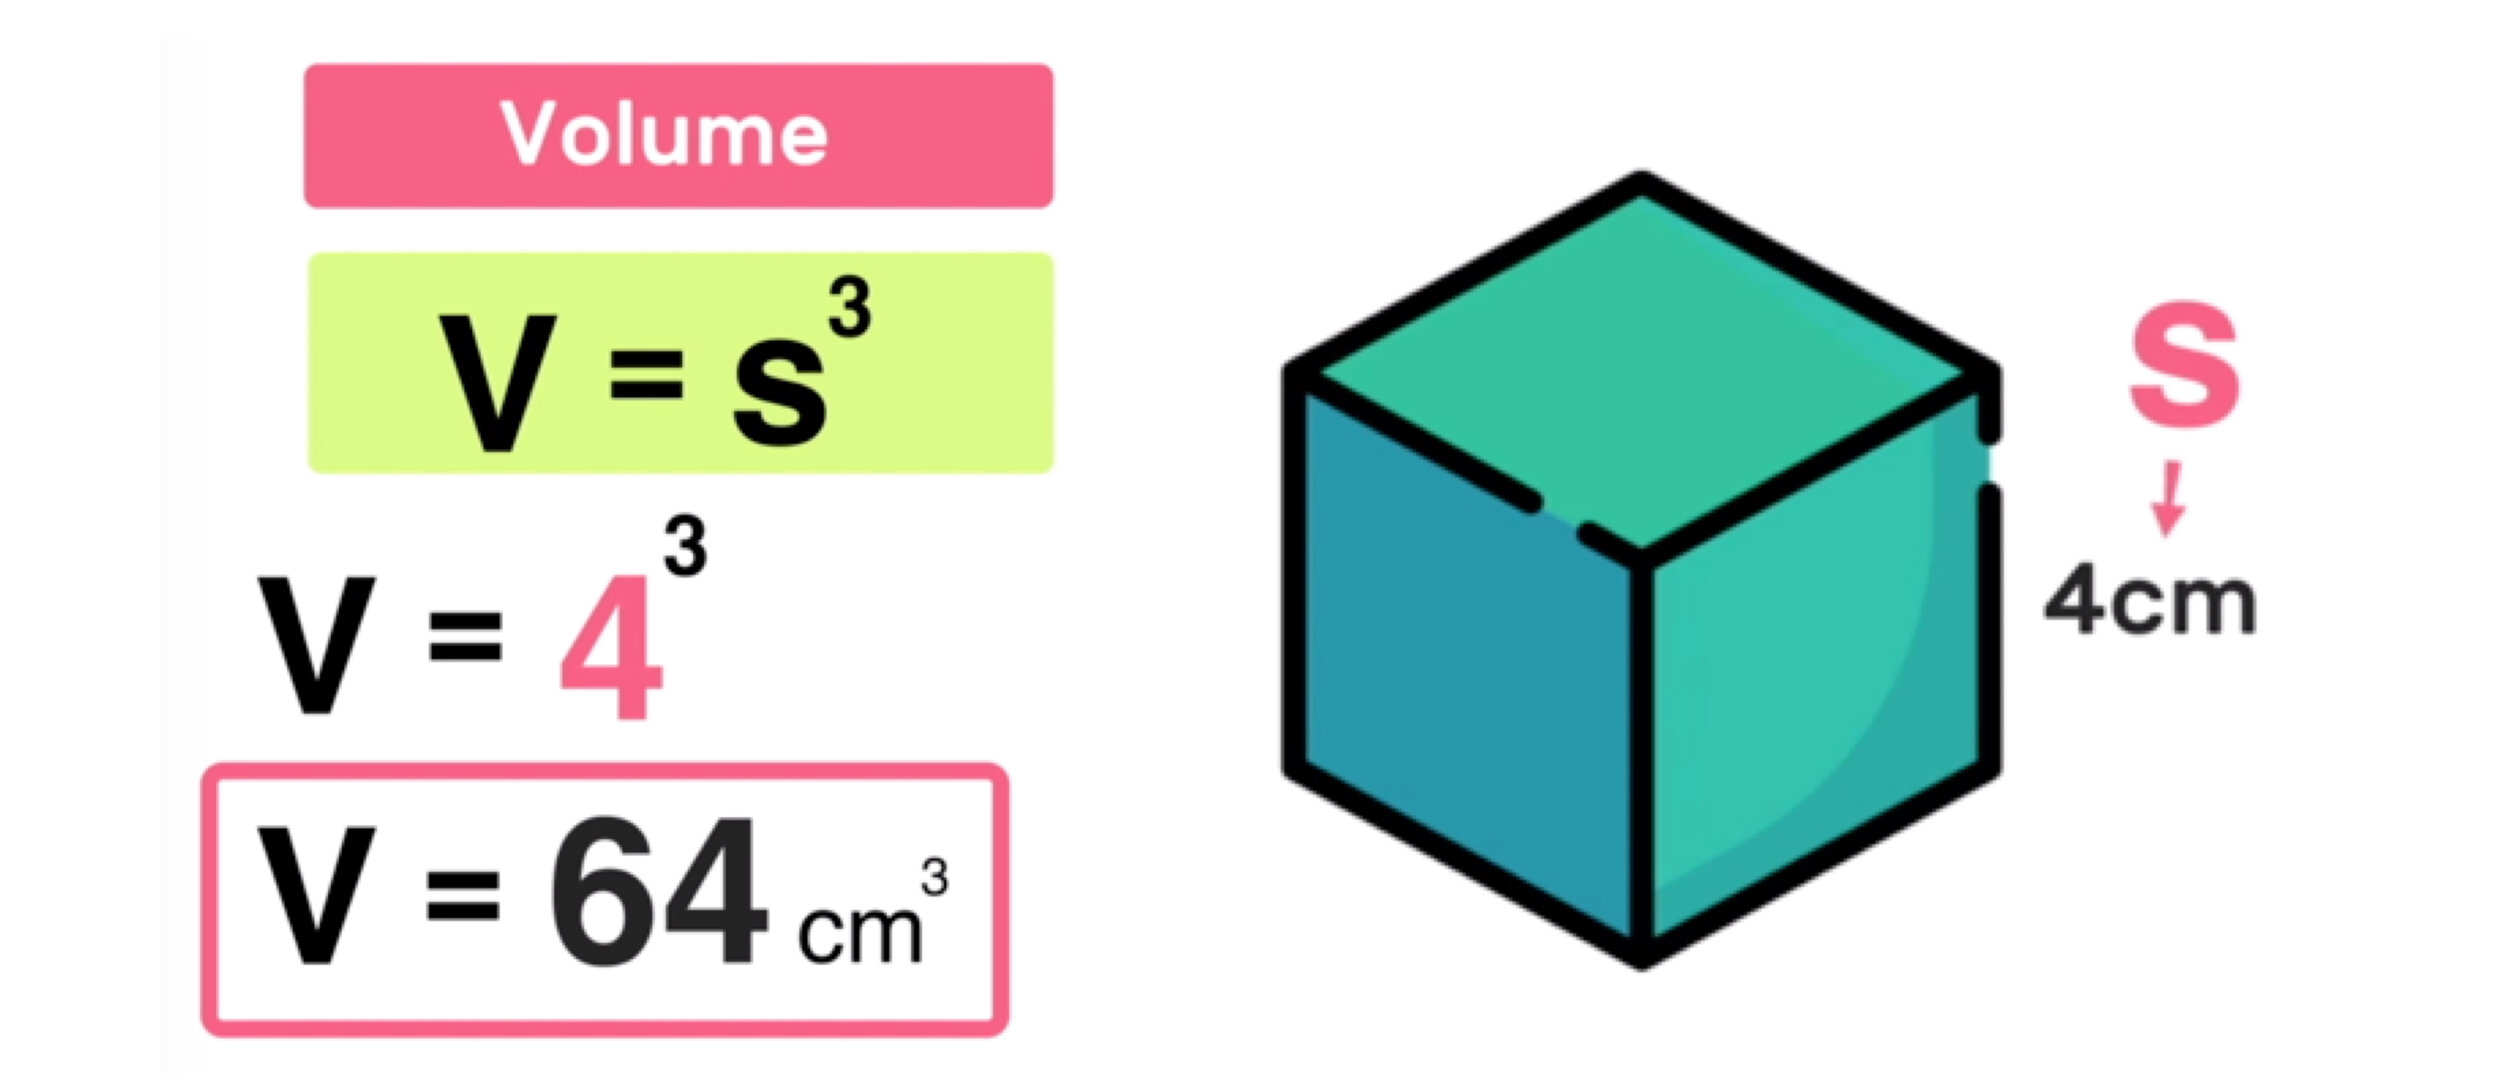
Find the volume of a cube with a side length of 4 cm.

 
Snip20210930_22.png
 

To solve this problem, we will use the previously mentioned 3-step process:

Step 1: Identify the value of s, the edge length of the cube

In this example, the cube has a side length of 4 cm, so S=4

Step 2: Substitute that value for s into the volume of a cube formula

Next, substitute 4 for s in the volume of a cube formula as follows

V = s^3 ➝ V = 4^3 ➝ V = 4x4x4 ➝ V = 64

Notice that 2x and 4x are like terms that can be combined.
 

Step 3: Solve and express your answer in cubic units

Finally, you can conclude that 4^ 3, or 4x4x4, equals 64, therefore…

Final Answer: The volume of the cube is 64 cubic centimeters.

Remember that volume is always expressed in cubic units (cubic centimeters in this example).

Remember that volume is always expressed in cubic units (cubic centimeters in this example).


Example #2: Find the Volume of the Cube

Find the volume of a cube-shaped box with a height of 9 inches.

 
Snip20210930_25.png
 

In this example, we are dealing with a cube-shaped box, which is still just a cube, so we can use the same three steps as Example #1 to find the volume:

Step 1: Identify the value of s, the edge length of the cube

In this example, the cube-shaped box has a side length of 9 inches, so S=9

Step 2: Substitute that value for s into the volume of a cube formula

Next, substitute 9 for s in the volume of a cube formula as follows

V = s^3 ➝ V = 9^3 ➝ V = 9x9x9 ➝ V = 729

Snip20210930_26.png
 

Step 3: Solve and express your answer in cubic units

Finally, you can conclude that 9^ 3, or 9x9x9, equals 729, therefore…

Final Answer: The volume of the cube is 729 cubic inches

Answer2.jpg
 

How to Find the Volume of a Cube

Are you looking for more help with finding the volume and surface area of cubes? Check out our free step-by-step video lesson below:

Volume of a Cube Calculator

Are you looking for a free volume of a cube calculator to quickly solve problems? While we recommend learning how to solve problems without relying on a calculator, there are times when this tool can be very useful (like when you need to check your answers for accuracy).

There are many cube volume calculator options available online, but we recommend Google’s free calculator, which you can access by Googling “volume of a cube calculator” or by clicking this link.

Note that Google used the letter a instead of the letter s.

 
Snip20210930_28.png
 

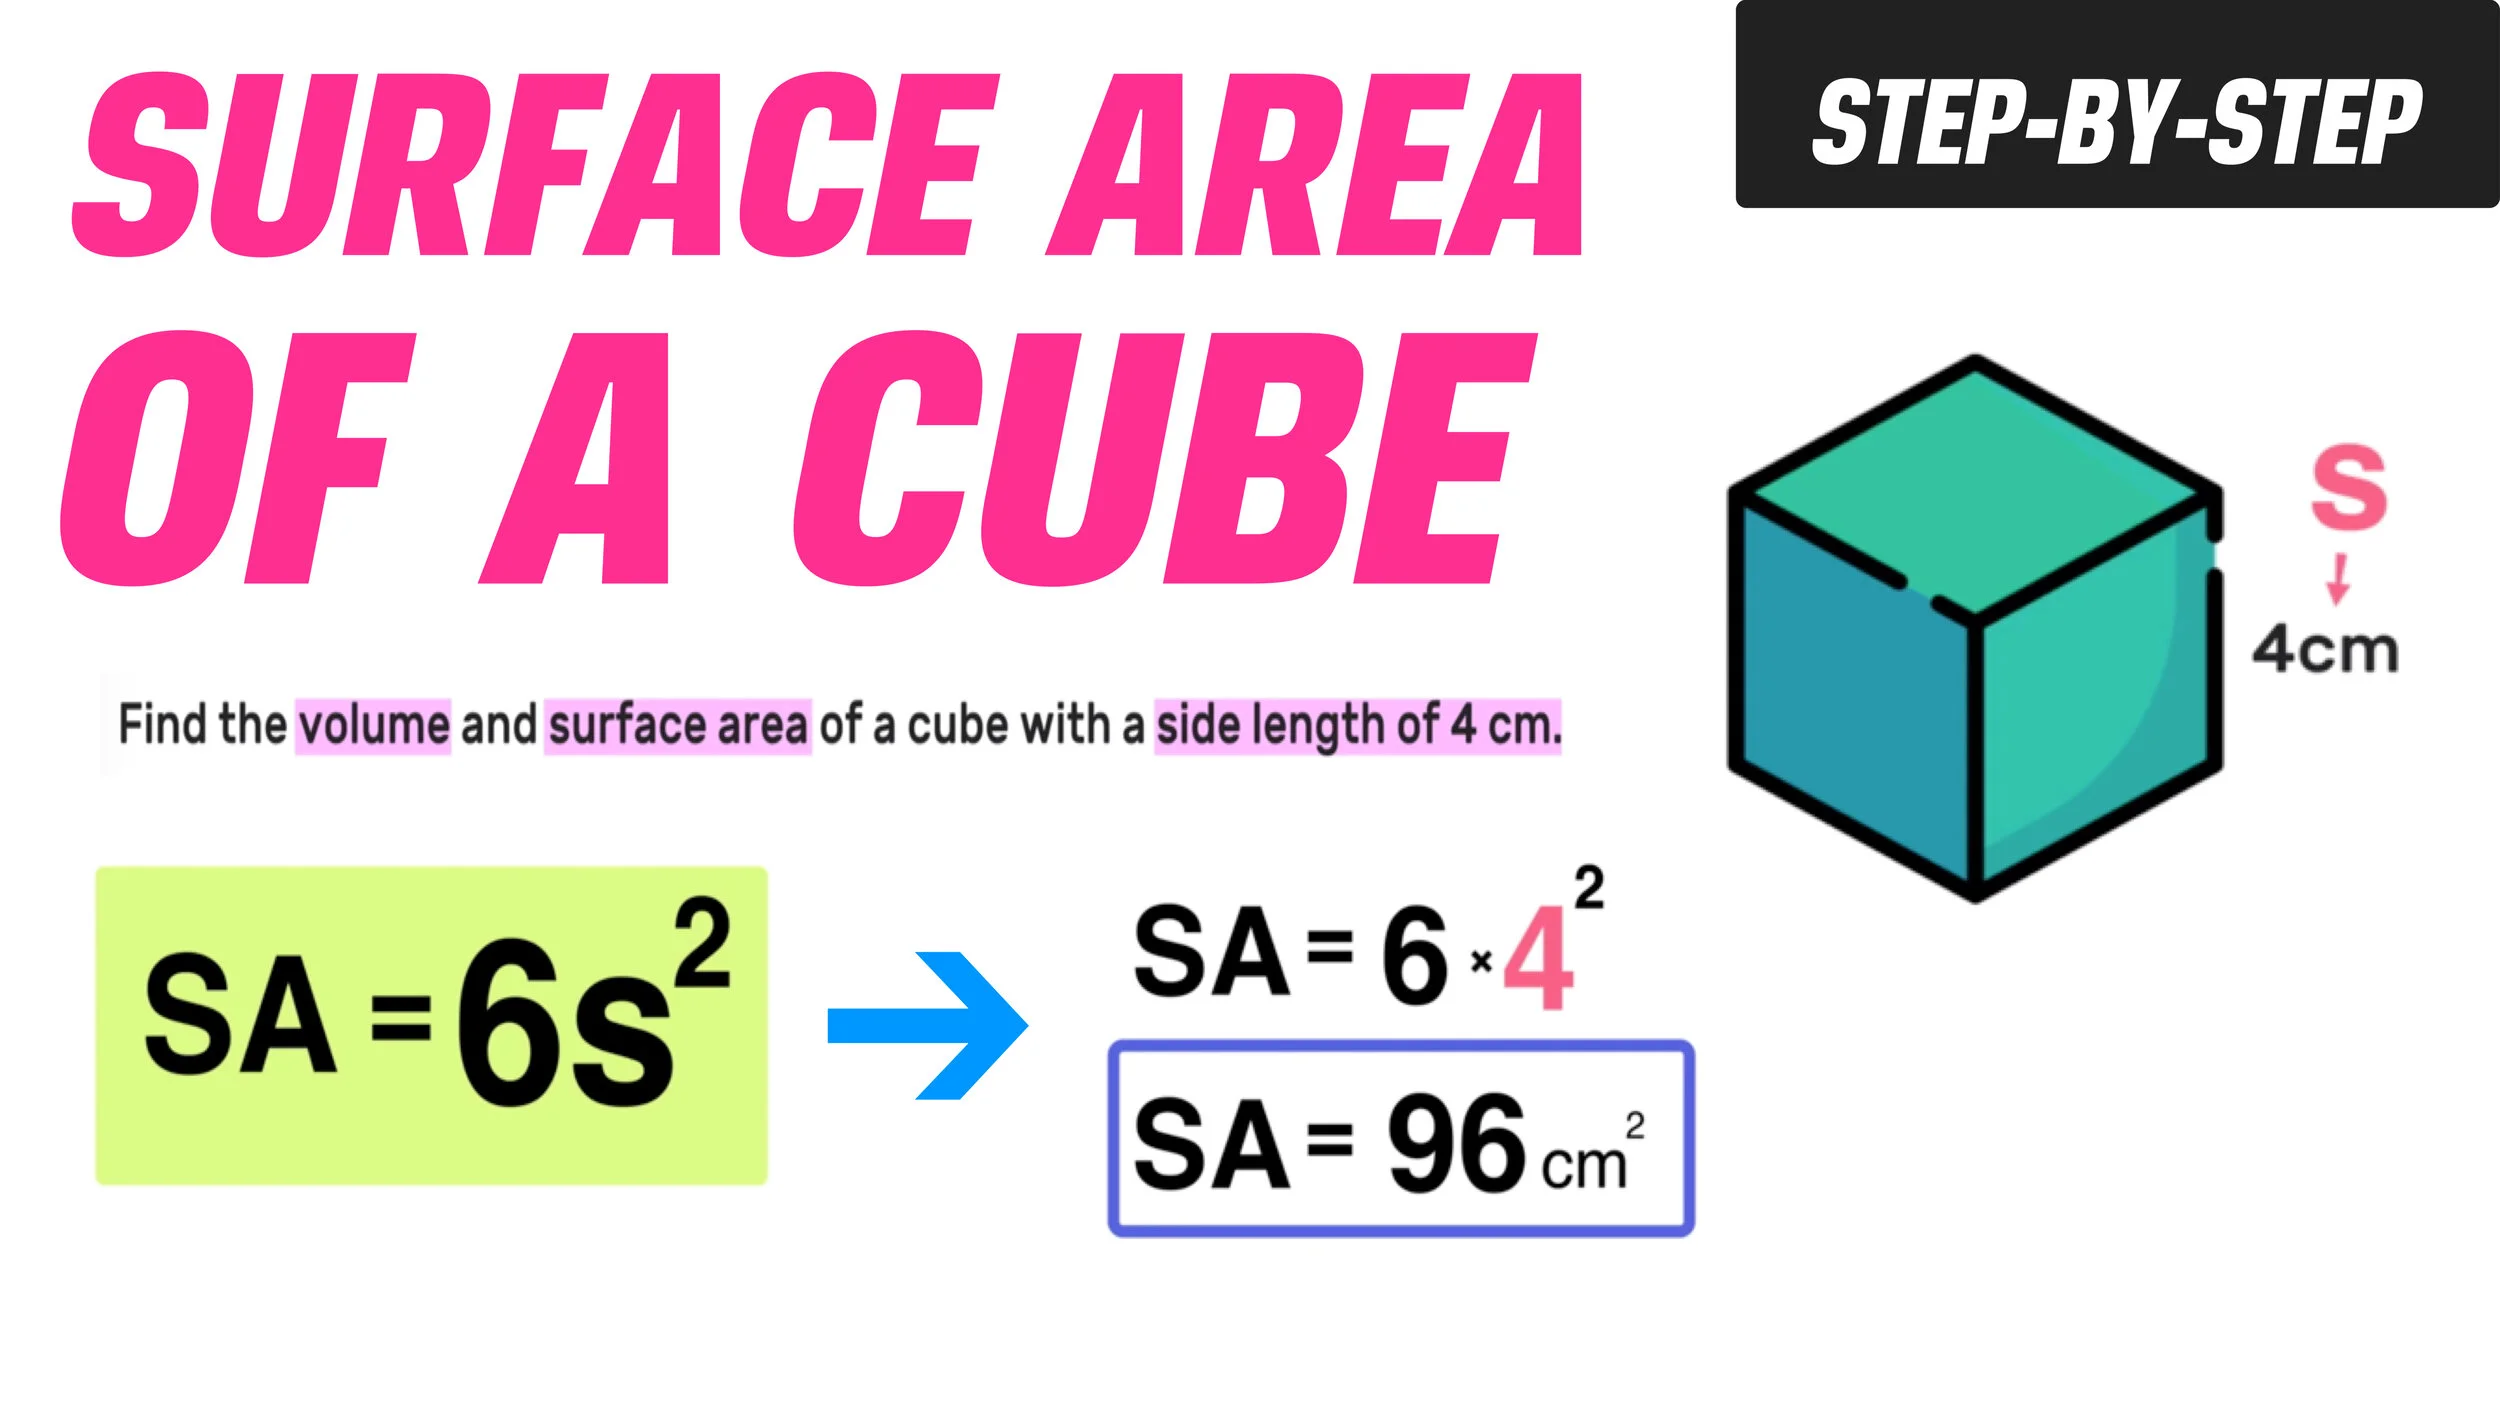
What About the Surface Area of a Cube?

SurfaceArea.jpg

Now that you know how to use a formula to find the volume of a cube, you are ready to learn how to use a different formula to find the surface area of a cube.

Whenever you are ready, use the link below to access our free guide to finding the surface area of a cube.

Click here to access a free Surface Area of a Cube step-by-step guide.

Conclusion: How to Find the Volume of a Cube

You can find the volume of any cube with edge length S by following this easy 3-step process:

Step 1: Identify the value of s, the edge length of the cube

Step 2: Substitute that value for s into the volume of a cube formula

Step 3: Solve and express your answer in cubic units

Keep Learning:

 
Pin-VolumeCube.jpg

Comment

Using Cheez Its to Teach Kids Area and Perimeter

4 Comments

Using Cheez Its to Teach Kids Area and Perimeter

DXx35pgUMAEzXUc.jpg

Are you looking for a fun and engaging activity to help your kids explore and understand the properties of area and perimeter?

In my recent VLOG, I share how you can use Cheez It crackers as a hands-on tool for exploring area and perimeter. The activity includes a free worksheet and includes ideas for higher-level applications.

This lesson can be applied at the elementary and middle school levels.

Download the free lesson worksheet: CLICK HERE 

Have any thoughts on this lesson idea? Share your thoughts and suggestions in the comments section below!

(Never miss a Mashup Math blog--click here to get our weekly newsletter!)

By Anthony Persico

Anthony is the content crafter and head educator for YouTube's MashUp Math and an advisor to Amazon Education's 'With Math I Can' Campaign. You can often find me happily developing animated math lessons to share on my YouTube channel . Or spending way too much time at the gym or playing on my phone.


4 Comments

How to Find Mean, Mean, Mode and Range: Your Complete Guide

1 Comment

How to Find Mean, Mean, Mode and Range: Your Complete Guide

Central Tendency: Mean, Median, Mode, and Range

MMMR_TNAIL.jpg

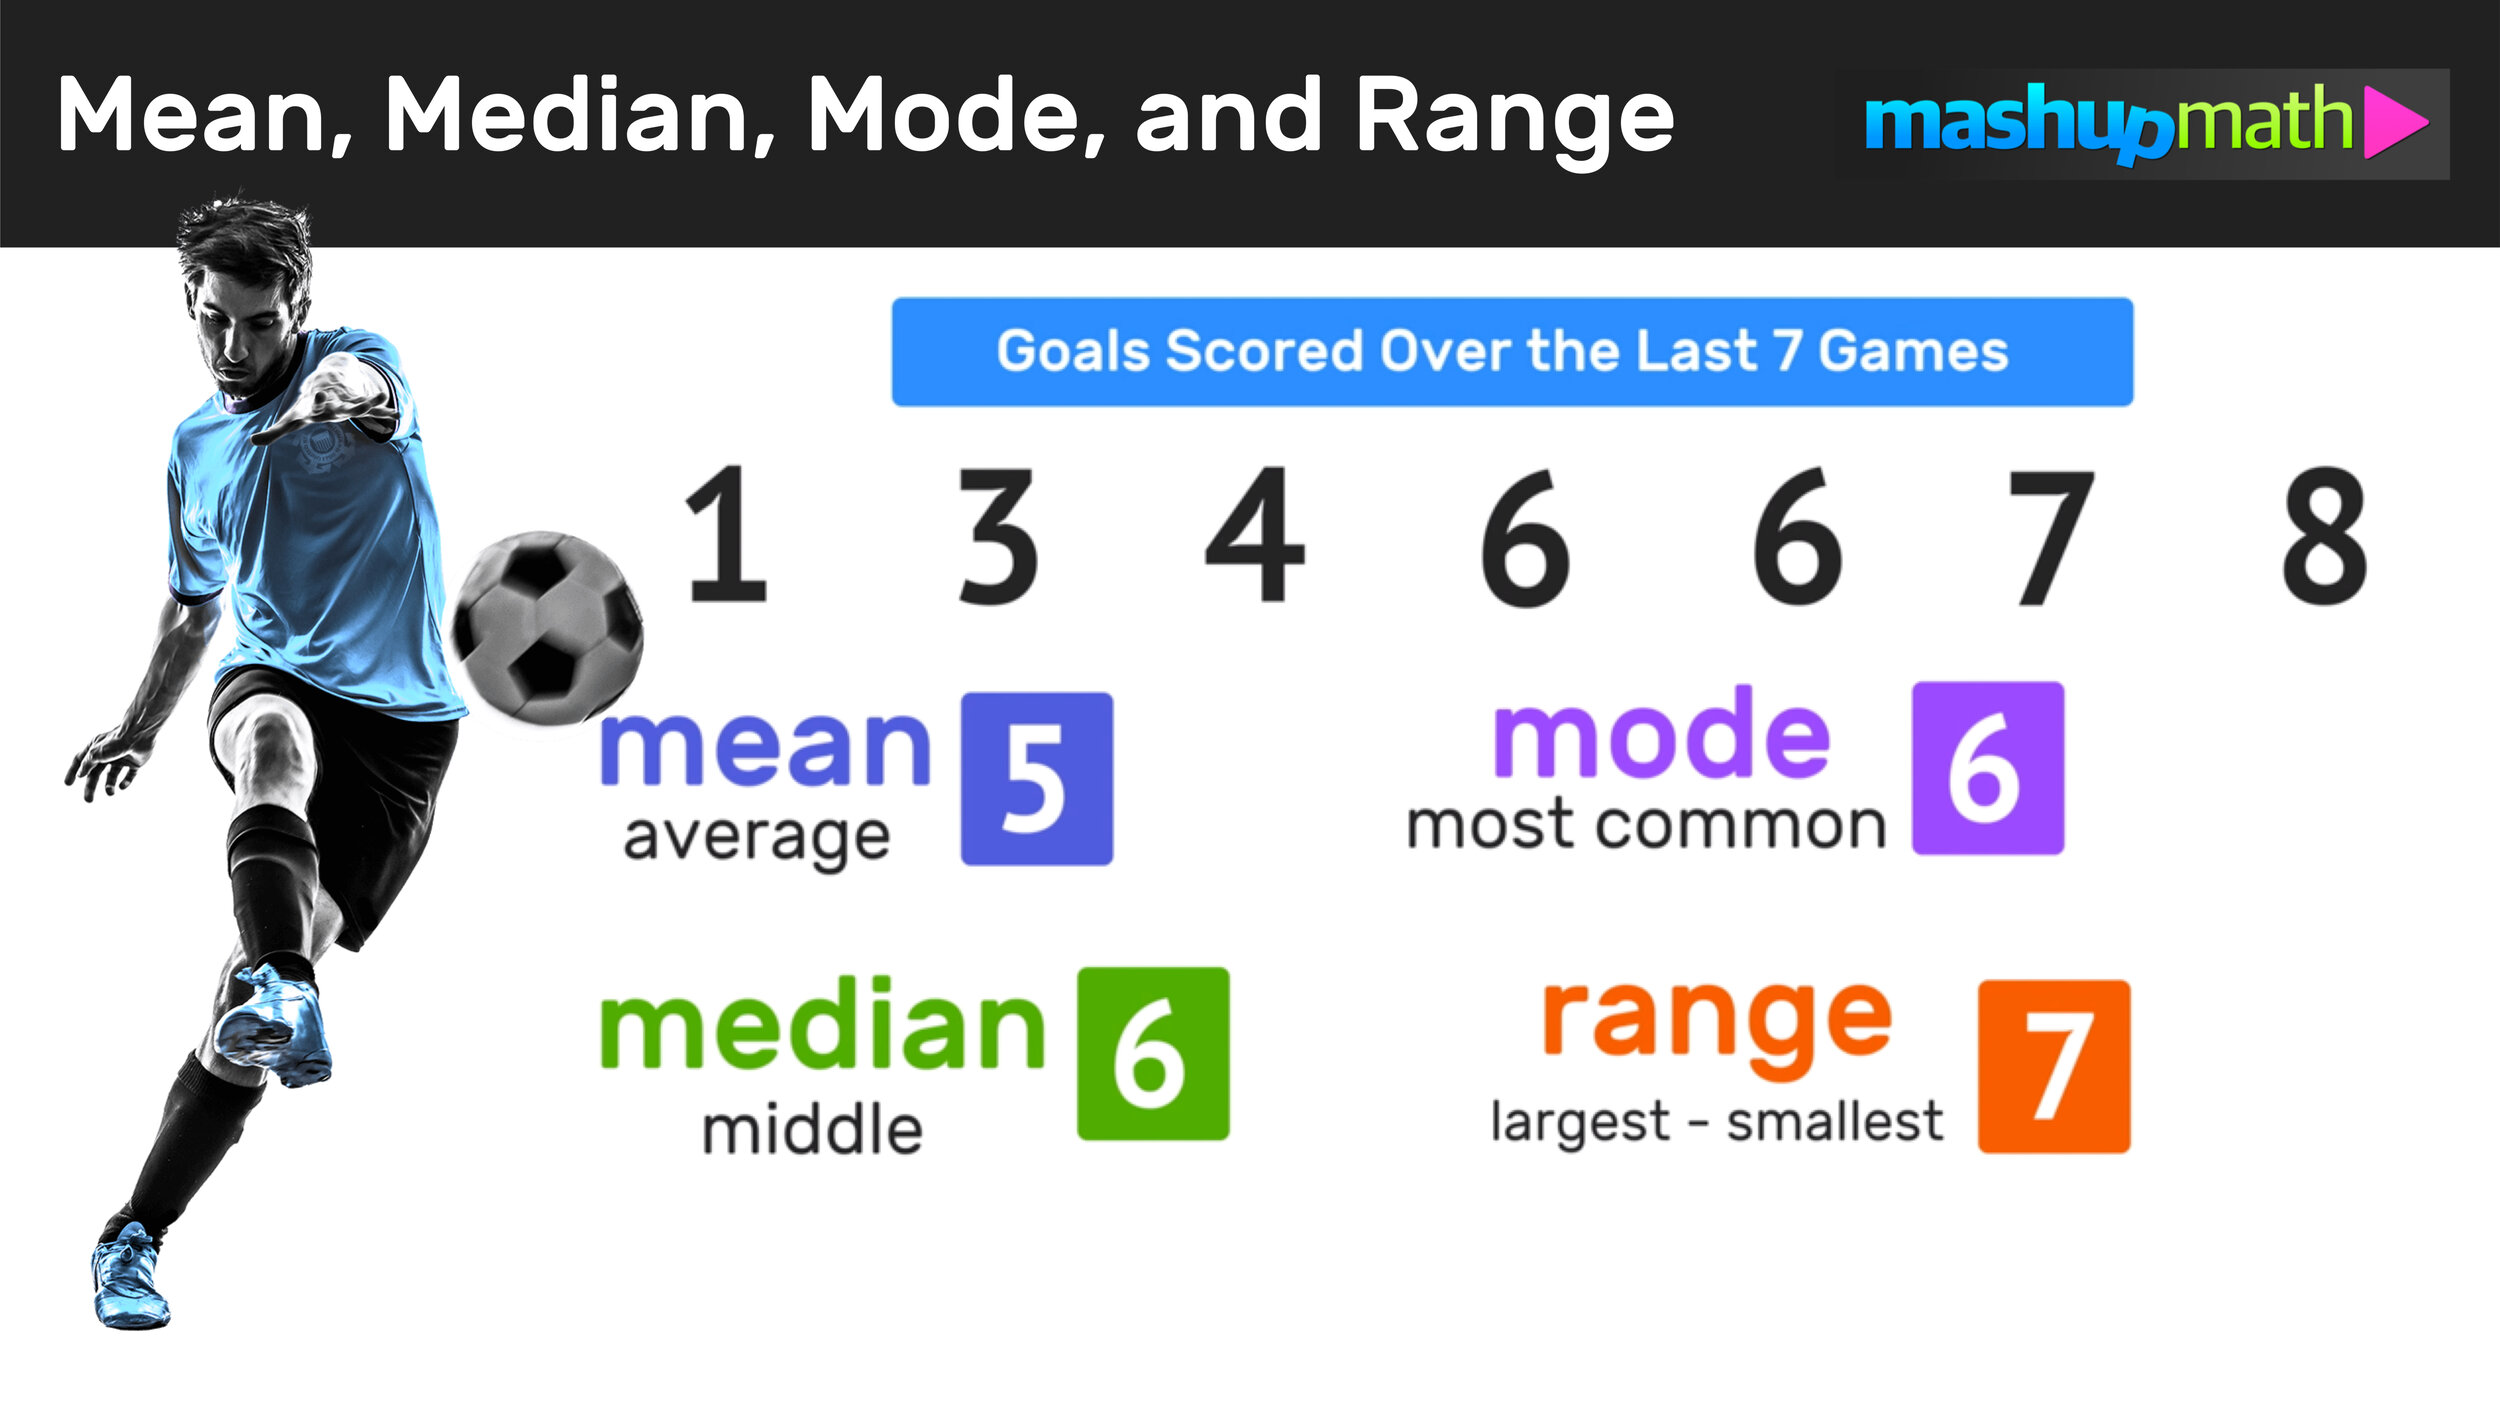
Welcome to this complete step-by-step guide to central tendency and how to find the mean, median, and mode of a data set.

This post will share key information, formulas, and vocabulary so that you can use math to determine the mean, median, mode, and range of any data set and understand what these values represent.

After working through two examples, you will also have access to a free mean, median, and mode pdf practice worksheet that includes an answer key.

Key Questions

Now let’s go ahead and begin this lesson by raising two key questions:

 For a given set of data…

  • What does the mean, median, mode, and range represent?

  • How can you find the mean, median, mode, and range of a data set?

What is Central Tendency?

Mean, median, and mode are measures of central tendency and are three different ways of expressing averages of a set of data.

 The key term here is average. In math, central tendency is a number or value that can be used to describe a central position, or average value, within a data set.

 Furthermore, the range of a set of data is the difference between the highest and lowest values.

Snip20210721_2.png

With this key math vocabulary in mind, let’s take a look at two examples

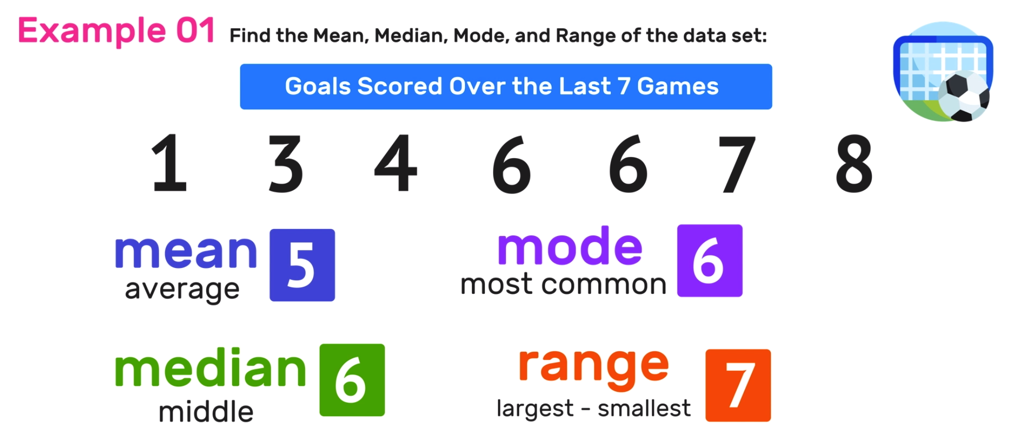
Example 01: Find the Mean, Median Mode, and Range

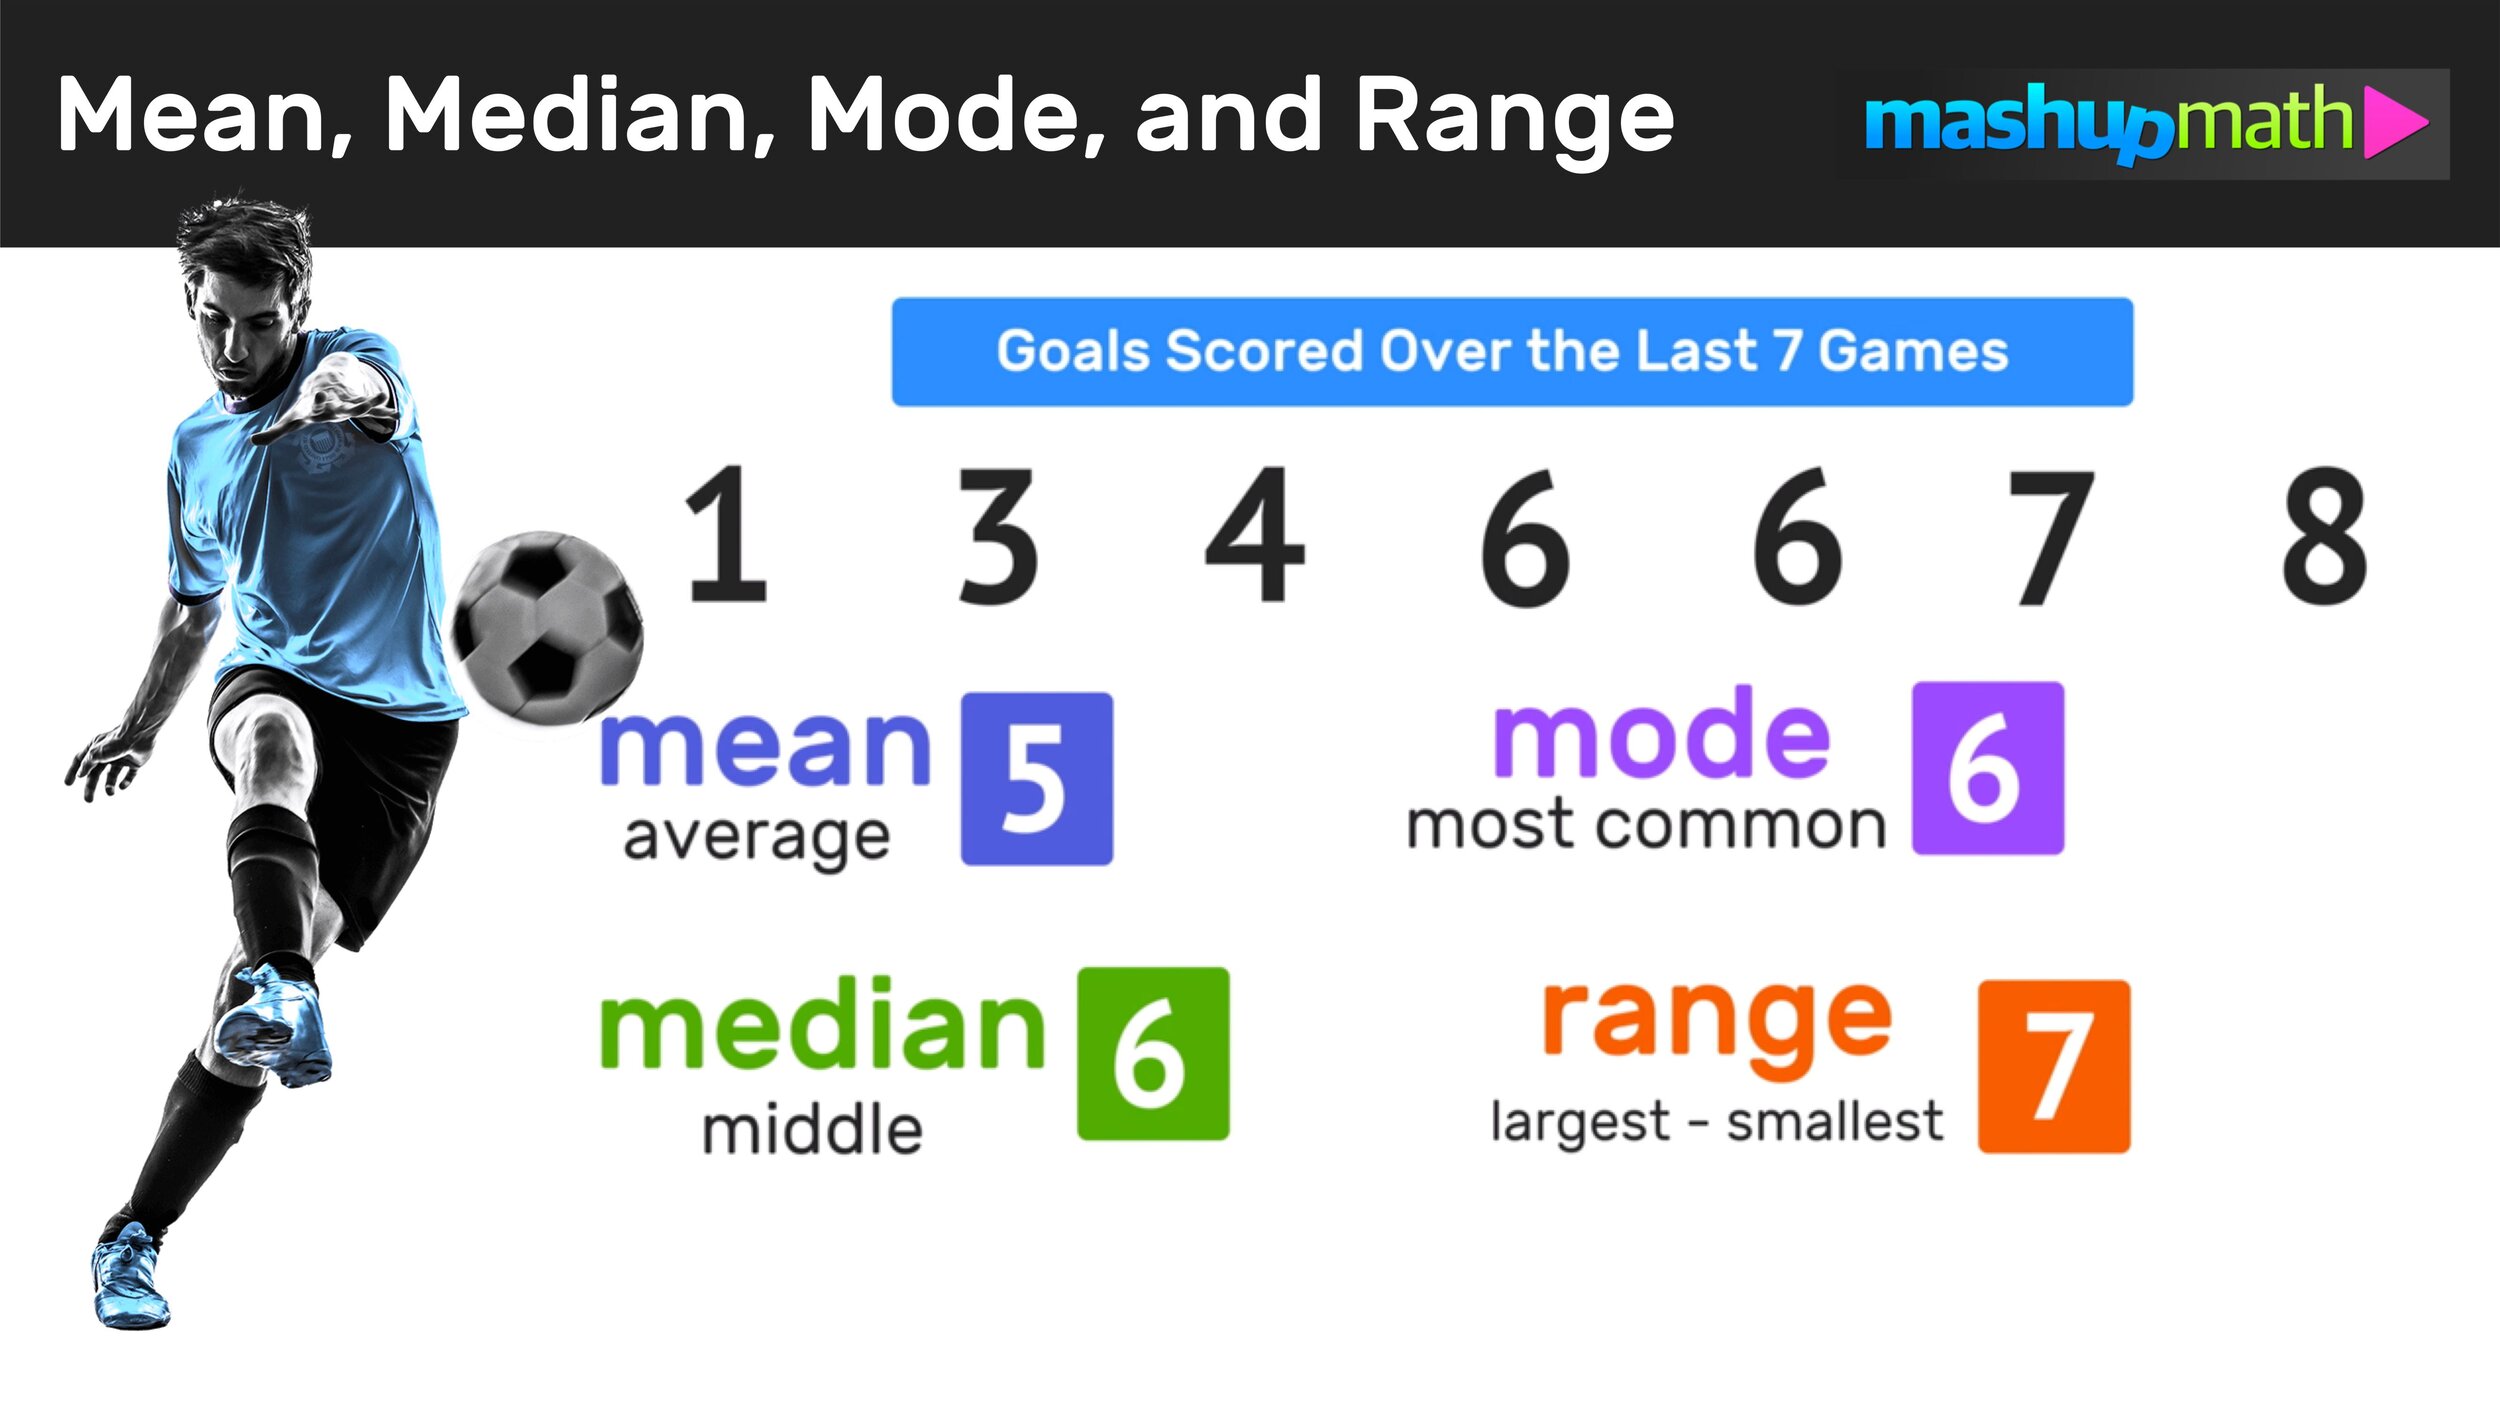
 Find the mean, median, mode and range of the data set: 1, 6, 7, 4, 6, 8, 3

Snip20210721_4.png

*Before you find the mean, median, mode, and range of a data set, be sure to rewrite the list of values in either ascending (least to greatest) or descending (greatest to least) form.

For today’s examples, we will be rearranging the original data set into ascending form where the values are placed in order from least to greatest as follows:

Snip20210721_5.png
 

Now that we have rearranged the values of the data set in ascending order, we are ready to find values of central tendency.

Step 01: Find the Mean

 How to Find the Mean of a Data Set

 The mean is the numerical average of a data set.

 To determine the mean of the data set, divide the total sum by the total amount of numbers.

 In this example, to find the total sum, add all seven values in the data set together as follows:

 1 + 3 + 4 + 6 + 6 + 7 + 8 = 35

 The total sum is 35.

 Next, divide the total sum by the total amount of numbers in the data set (which, in this example is 7).

 35/7 =5  >>> The mean is 5 goals per game.

Snip20210721_6.png
 

Mean Formula

For future reference, here is a handy formula that you can always use to find the mean of a data set. To determine the mean, simply divide the total sum of all of the values in the data set by the total number of values as follows:

 
MeanFormula.jpg
 

Step 02: Find the Median

The median is the middle number or value of a data set.

To determine the median of numbers in the data set, simply find the middle value.

In this example, notice that there is an odd number of values in the data set (7 total). To find the median of numbers, start crossing the “bookend values” on each side of the data set as you make your way towards the middle until only one value remains as follows…

Snip20210721_9.png
 

Clearly, the middle value is 6, so you can conclude that the median of the data set is equal to 6.

Snip20210721_10.png
 

*Note that when there is an even number of values in the data set, using this strategy to find the median will require one extra step (we will go more in depth in example 2).

Median Calculator

Looking for a quick way to central tendency values? This median calculator (which is really a mean, median, mode calculator from Calculator Soup) is an excellent tool for quickly finding these values. However, this website should only be used a tool for checking your work and not a substitute for understanding how to actually find the mean, median, mode, and range of a data set.

Step 03: Find the Mode

 The mode of a data set is the most common number. It is possible to have more than one mode, or no mode at all.

 If you’re looking for a simple answer to how to find the mode of a data set, then you’re in the right place. To find the mode, simply look for the value that occurs the most often (i.e. the value that repeats more than any other value).

In this example, notice that the only value that repeats is 6…

Snip20210721_12.png
 

Therefore, you can conclude that the mode for this data set is 6.

Snip20210721_13.png
 

How to find the mode of a data set…

Just like in example 01, you can find the mode of a data set by determining which value is the most common. You can find this value by looking for numbers that repeat.

And remember that it is possible to have more than one mode or no mode at all!

Step 04: Find the Range

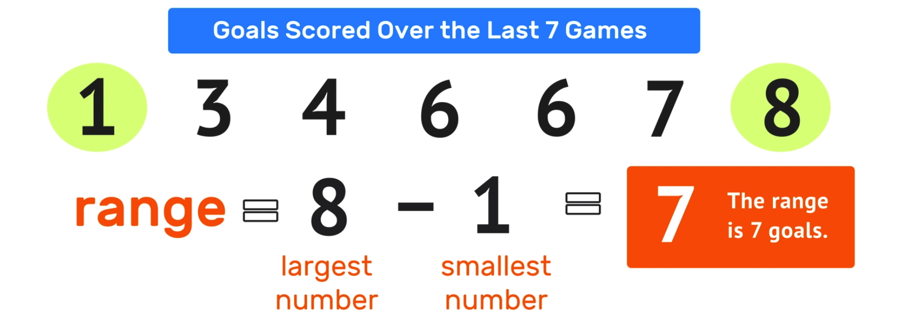
The range is the difference between the highest and lowest values in the data set (the largest number minus the smallest number).

 To calculate range math, simply determine the largest and smallest values and then find the difference by subtracting (rearranging the numbers in ascending order at the very start of this example males calculating the range very easy).

In this example, the largest number in the data set is 8 and the smallest number in the data set is 1.

To find the range, simply perform 8 – 1 = 7

Therefore, the range is 7 goals.

Snip20210721_14.png
 

Quick Summary:

 And now we have found all values of central tendency for this example. Here is a quick summary of what you just did!

 Keep in mind that the process for determining mean, median, mode, and range of any data set is pretty much always the same. So, now let’s try a second example that involves a larger data set!

Snip20210721_15.png
 

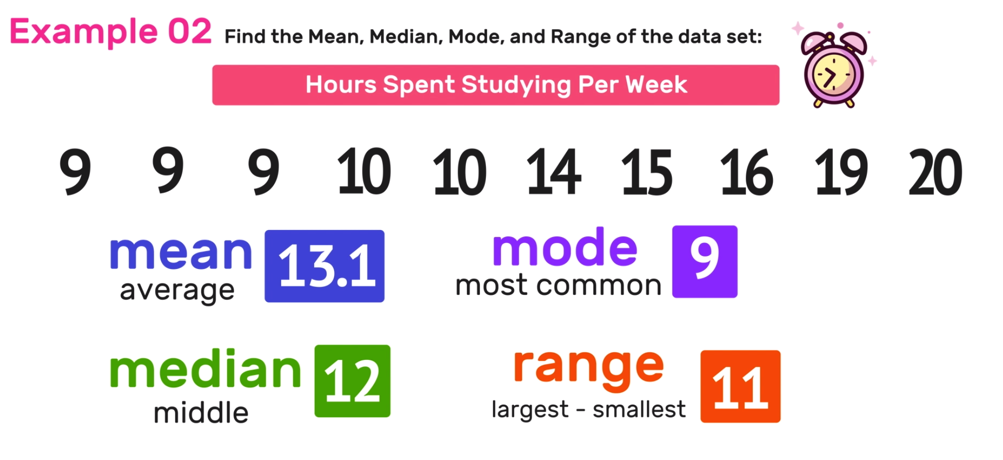
Example 02: Find the Mean, Median Mode, and Range

Find the mean, median, mode and range of the data set: 15, 9, 16, 9, 20, 14, 10, 9, 10, 9

Snip20210721_16.png
 

Again, just like in Example 01, start by rearranging the numbers in the data set so that they are in ascending order from left to right…

Snip20210721_17.png
 

*Note that the values in the data set have not changed. All that you did was rewrite them in order from least to greatest, which will make finding the mean, median, mode, and range much easier for you (with or without a calculator).

Now you are ready to find the mean, median, mode, and range of this data set.

Step 01: Determine the Mean

To find the mean of the data set, remember to apply the mean formula, where you find the total sum of all of the numbers and divide it by the total number of values in the data set.

Snip20210721_18.png
 

In this case…

9 + 9 + 9 + 10 + 10 + 14 +15 + 16 + 19 + 20 = 131 (the total sum)

and there are 10 total numbers.

131/10 =13.1  >>> The mean is 13.1 hours studying

*Note that it will often be the case that the mean value is decimal.

Snip20210721_19.png
 

Step 02: Find the Median

Remember that the median represents the middle value of a data set.

To determine the median of numbers in the data set, you perform the same process of crossing out the “bookend values” on the left and right of the data set until you reach the middle. Unlike the last example where the data set had an odd number of values, this data set has an even number of values (ten in total), which means that there will one be extra step involved to find the median.

Snip20210721_20.png
 

After crossing out the outside values and working your way to the middle, you will notice that, because the data set has an even number of values, there are two values in the middle (in this case, 10 and 14).

So, which value is the median?

In cases like this, the median is the average of the two values. To find the average, simply add the two values together and divide the sum by two as follows:

10+ 14 = 24 >>> 24/2 =12

The median of the data set is 12 hours.

Snip20210721_21.png
 

Step 03: Find the Mode

Remember that the mode of any data set is the most common number and that the key to finding the mode is to look for repeat values.

Snip20210721_22.png
 

Notice that this data set has two values that occur more than once: 9 and 10. In this case, 9 shows up three times and 10 shows up twice. Since 9 shows up more often than 10, you can conclude that 9 is the most common number in the data set and that the mode is 9.

Snip20210721_23.png
 

Step 04: Find the Range Math

The last remaining measure of central tendency that you must find is the range, which is the difference between the largest number and the smallest number.

To calculate range for this example, look at the data set and identify the largest value (20) and the smallest value (9) and then find the difference as follows

20 -9 = 11 >>> The range of the data set is 11.

Snip20210721_24.png
 

Example 02 Conclusion

Snip20210721_25.png
 

You can click the link below to watch the animated video that accompanies this lesson.


Have thoughts? Share your thoughts in the comments section below!

(Never miss a Mashup Math blog--click here to get our weekly newsletter!)

More Posts You Will Love:


By Anthony Persico

Anthony is the content crafter and head educator for YouTube's MashUp Math. You can often find me happily developing animated math lessons to share on my YouTube channel . Or spending way too much time at the gym or playing on my phone.

1 Comment

Parallelogram Lines of Symmetry Explained!

1 Comment

Parallelogram Lines of Symmetry Explained!

Everything You Need to Know About Parallelogram Lines of Symmetry

Title.jpg

Every Geometry class or course will include a deep exploration of the properties of parallelograms. In this post, we will quickly review the key properties of parallelograms including their sides, angles, and corresponding relationships.

Finally, we will determine whether or not a parallelogram has line symmetry. And, if a parallelogram has line symmetry, what would parallelogram lines of symmetry look like (in the form of a diagram).

Before we answer these key questions related to the symmetry of parallelograms, let’s do a quick review of the properties of parallelograms:

 What is a parallelogram?

 Definition: A parallelogram is a special kind of quadrilateral (a closed four-sided figure) where opposite sides are parallel to each other and have equal length.

Furthermore, the interior opposite angles in any parallelogram have equal value. And any pair of adjacent interior angles in a parallelogram are supplementary (they have a sum of 180 degrees).

 The following diagram illustrates these key properties of parallelograms:

 Parallelogram Lines of Symmetry


Now that you understand the key properties and angle relationships of parallelograms, you are ready to explore the following questions:

  •  Do parallelograms have line symmetry?

  • What is the number of lines of symmetry in a parallelogram?

  • If parallelograms do not have lines of symmetry, then why doesn’t a parallelogram have lines of symmetry?

For starters, let's note that a line of symmetry is an axis or imaginary line that can pass through the center of a shape (facing in any direction) such that it cuts the shape into two equal halves that are mirror images of each other.

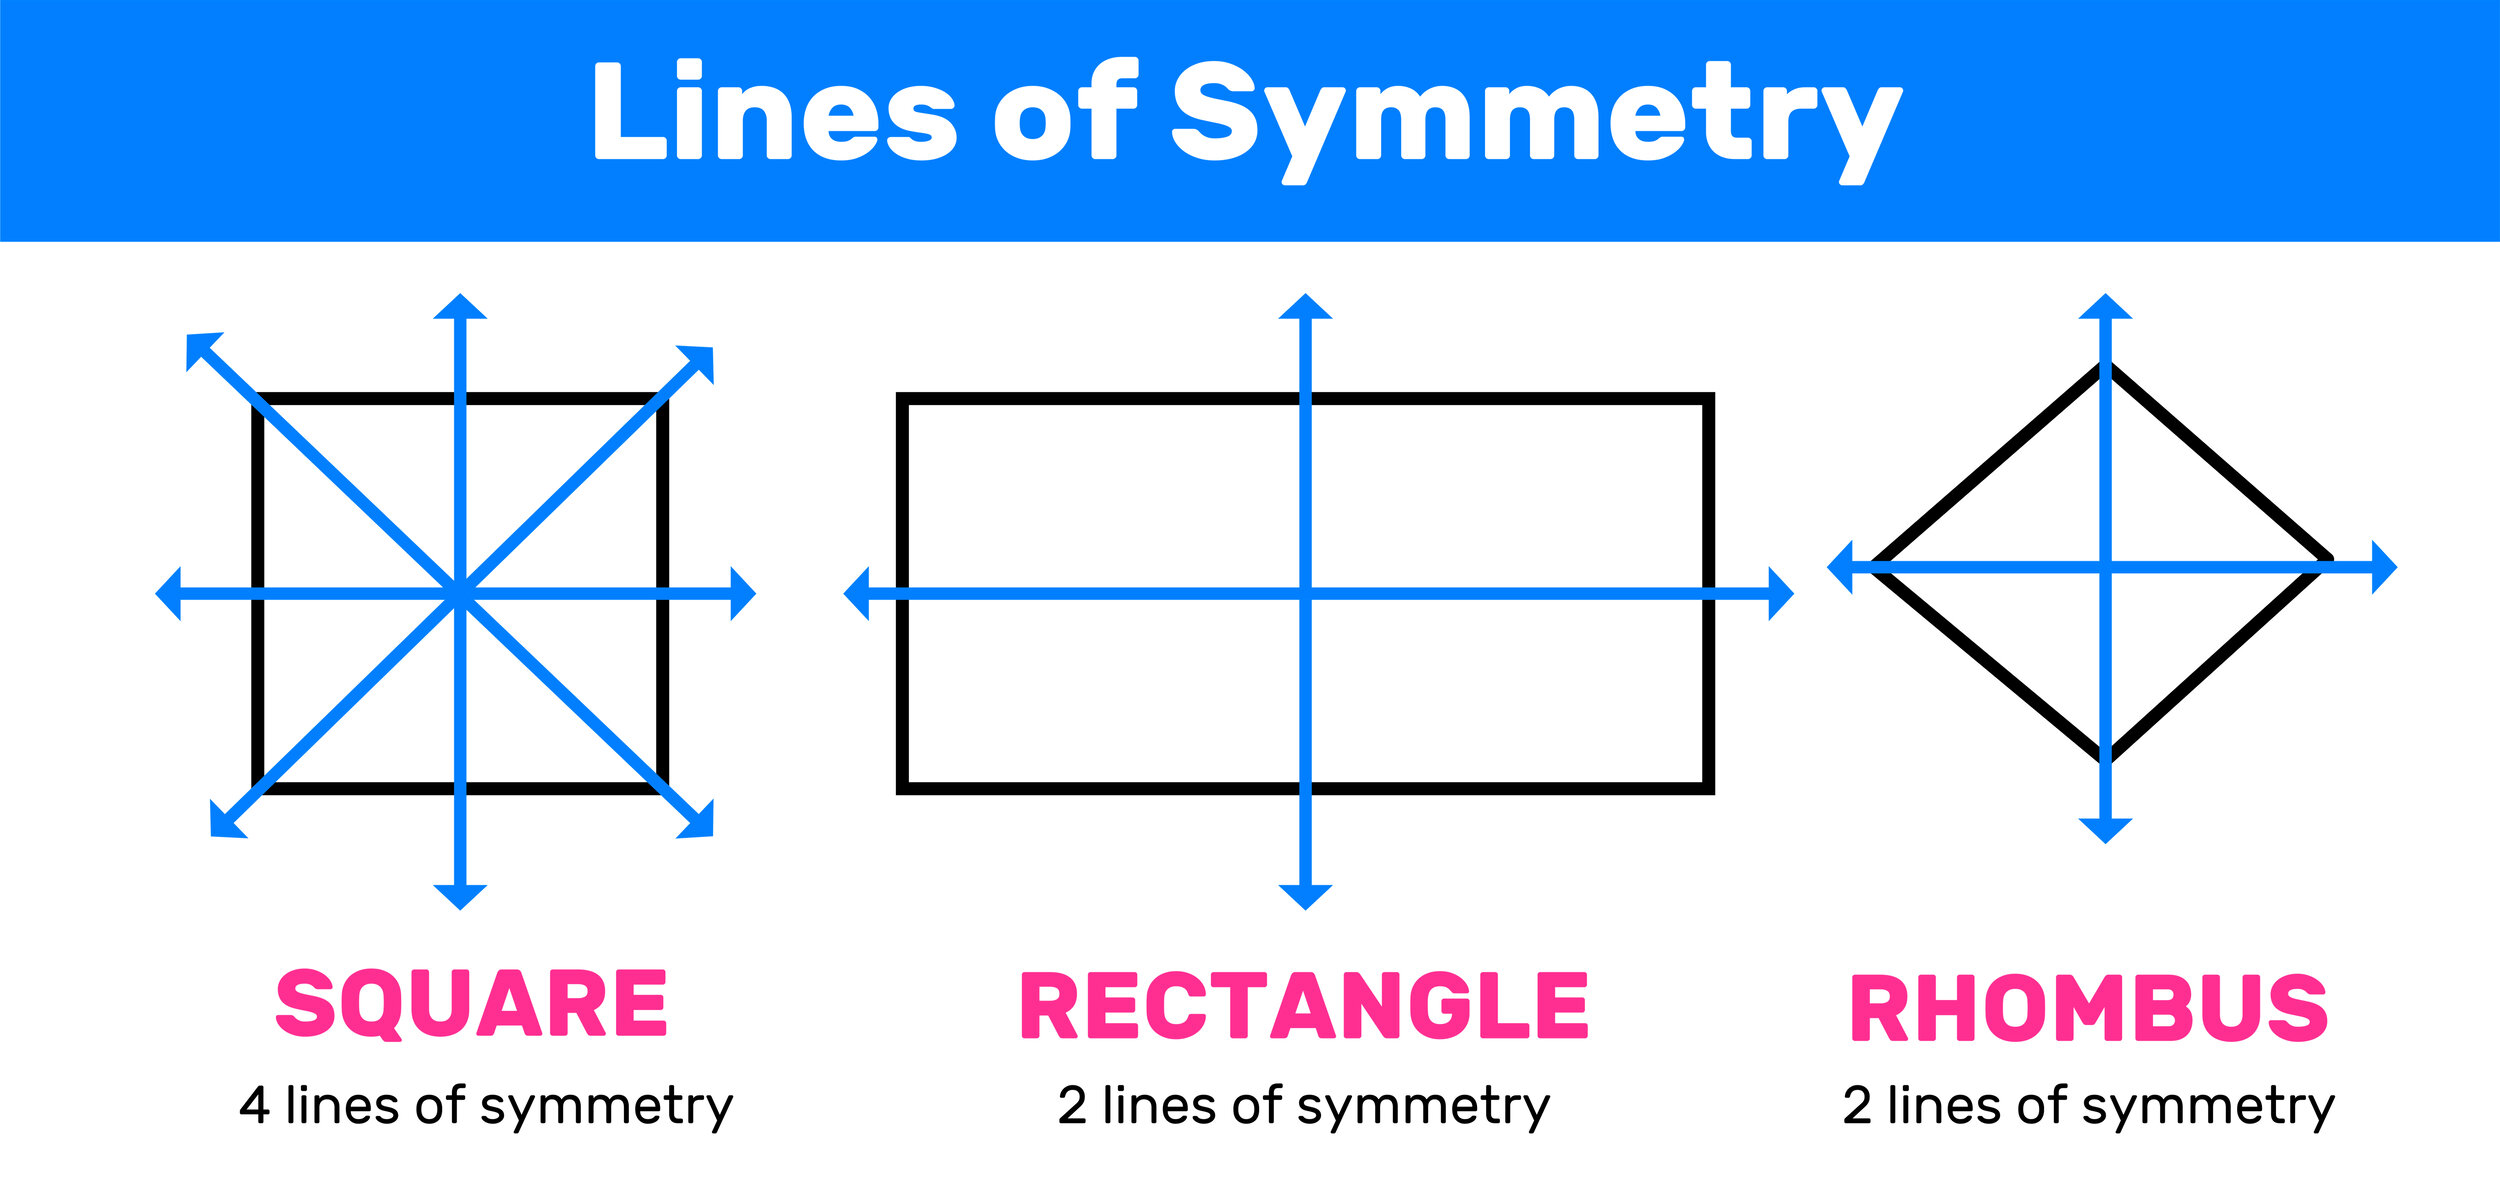
For example, a square, a rectangle, and a rhombus all have line symmetry because at least one imaginary line can be drawn through the center of the shape that cuts it into two equal halves that are mirror images of each other.

In fact, a shape can have multiple lines of symmetry. In the diagram below, you can see that a square has four lines of symmetry, while a rectangle and a rhombus each have only two lines of symmetry.

Lines.jpg

What about a parallelogram?

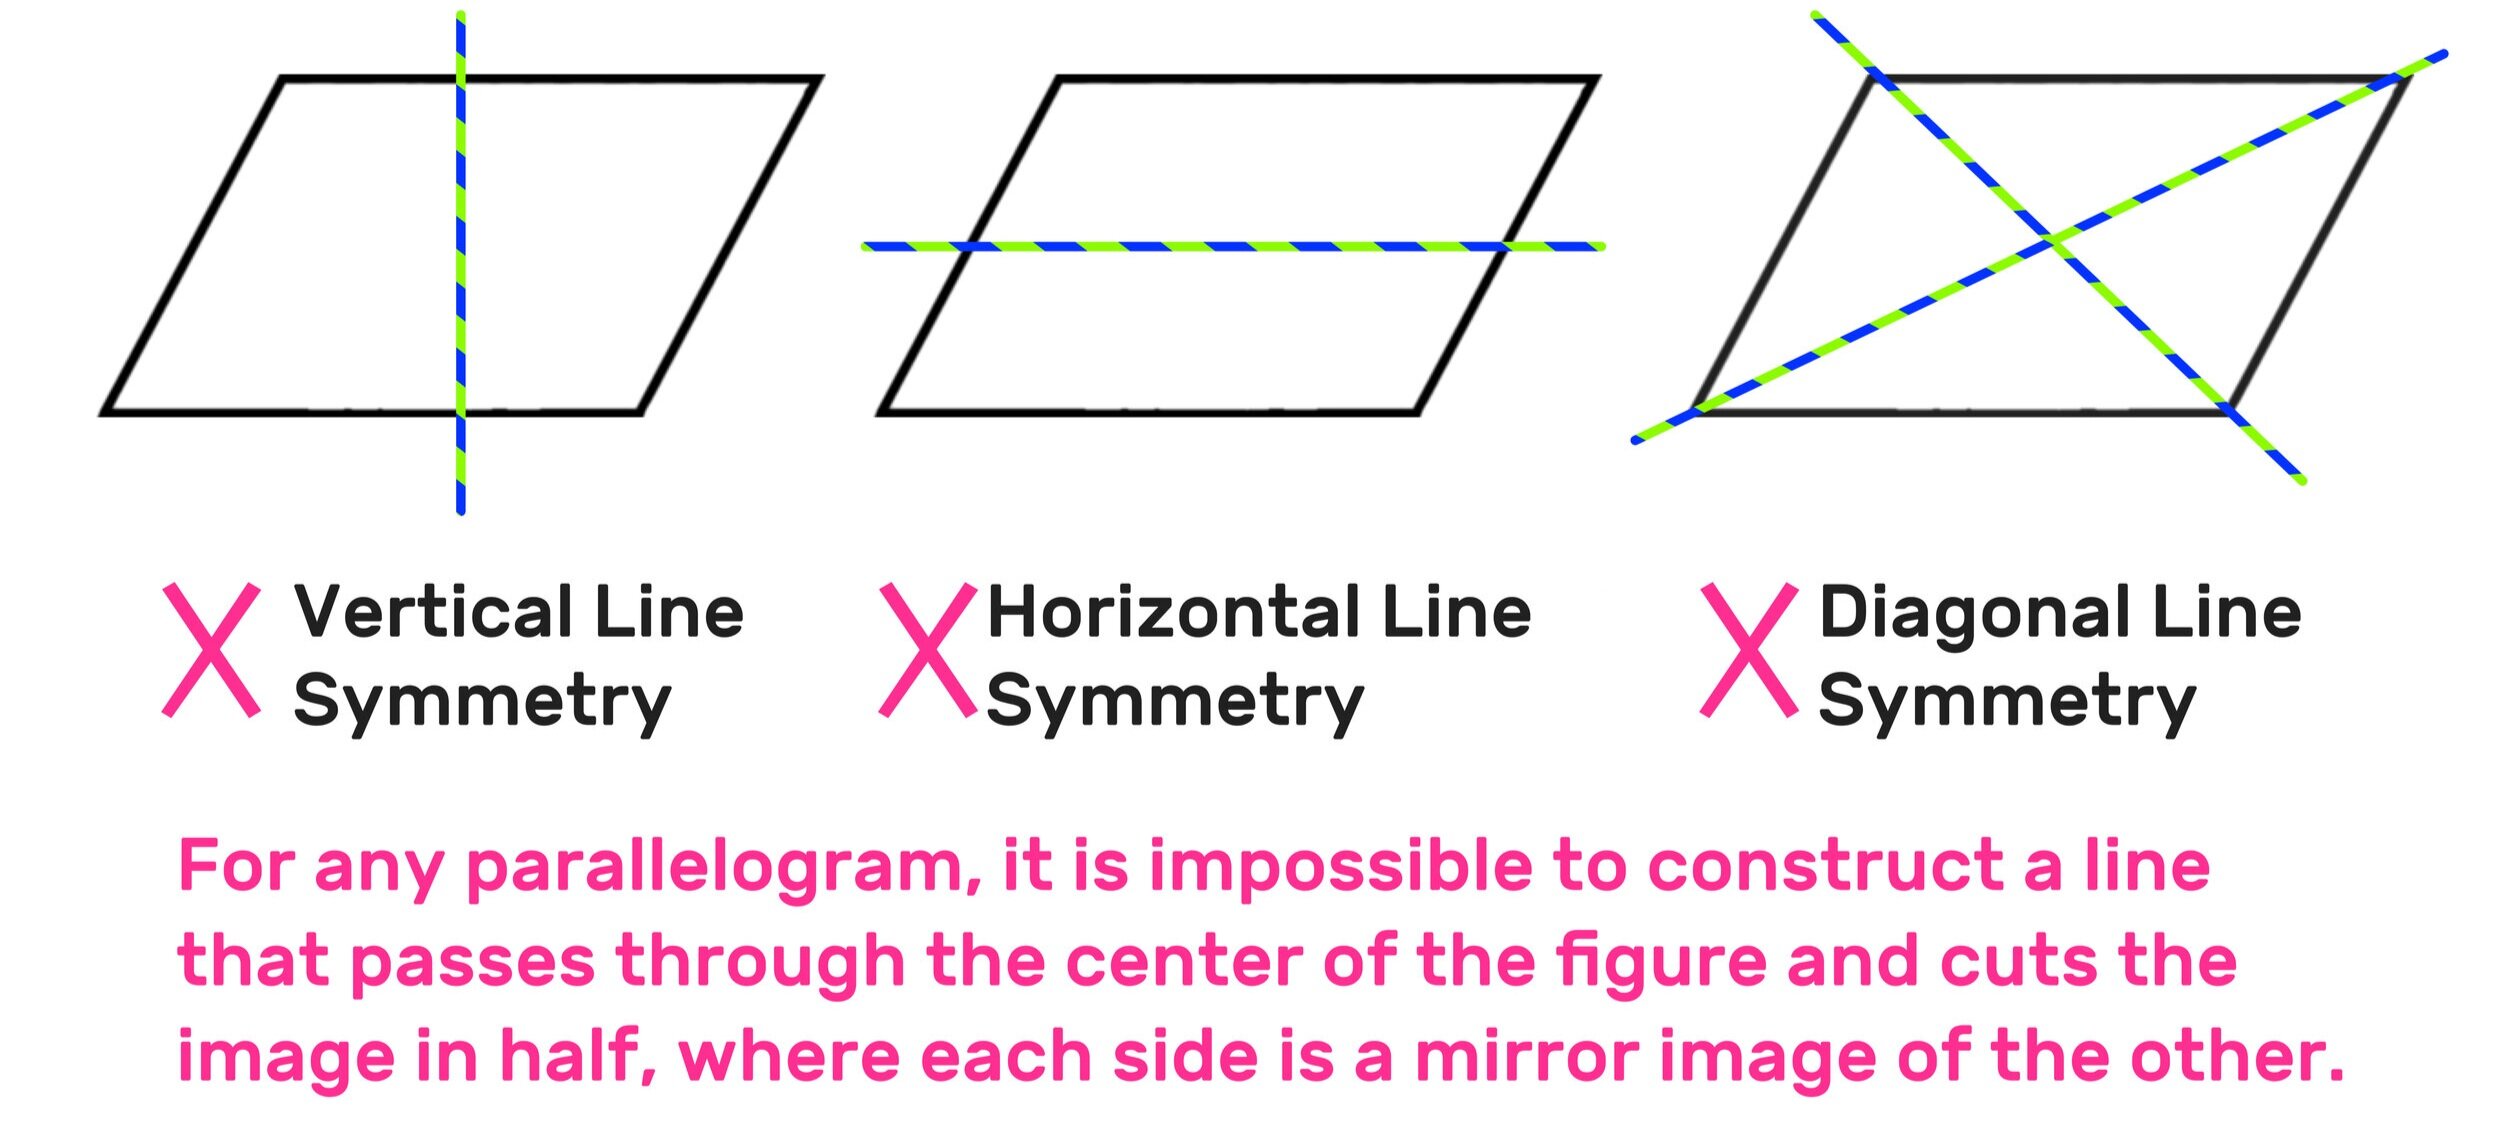
 It turns out that a parallelogram does not have any lines of symmetry.

But why doesn’t a parallelogram have lines of symmetry? Because, for any parallelogram, it is impossible to construct a line of symmetry (an axis or imaginary line that passes through the center of the figure and cuts the image in half, where each side is a mirror image of the other).

 You can go ahead and try to construct a line of symmetry on any parallelogram and you will see that it is impossible.

 The figure below, summarizes why the total number of lines of symmetry in a parallelogram is zero.

Conclusion.jpg

Does a parallelogram have any symmetry at all?

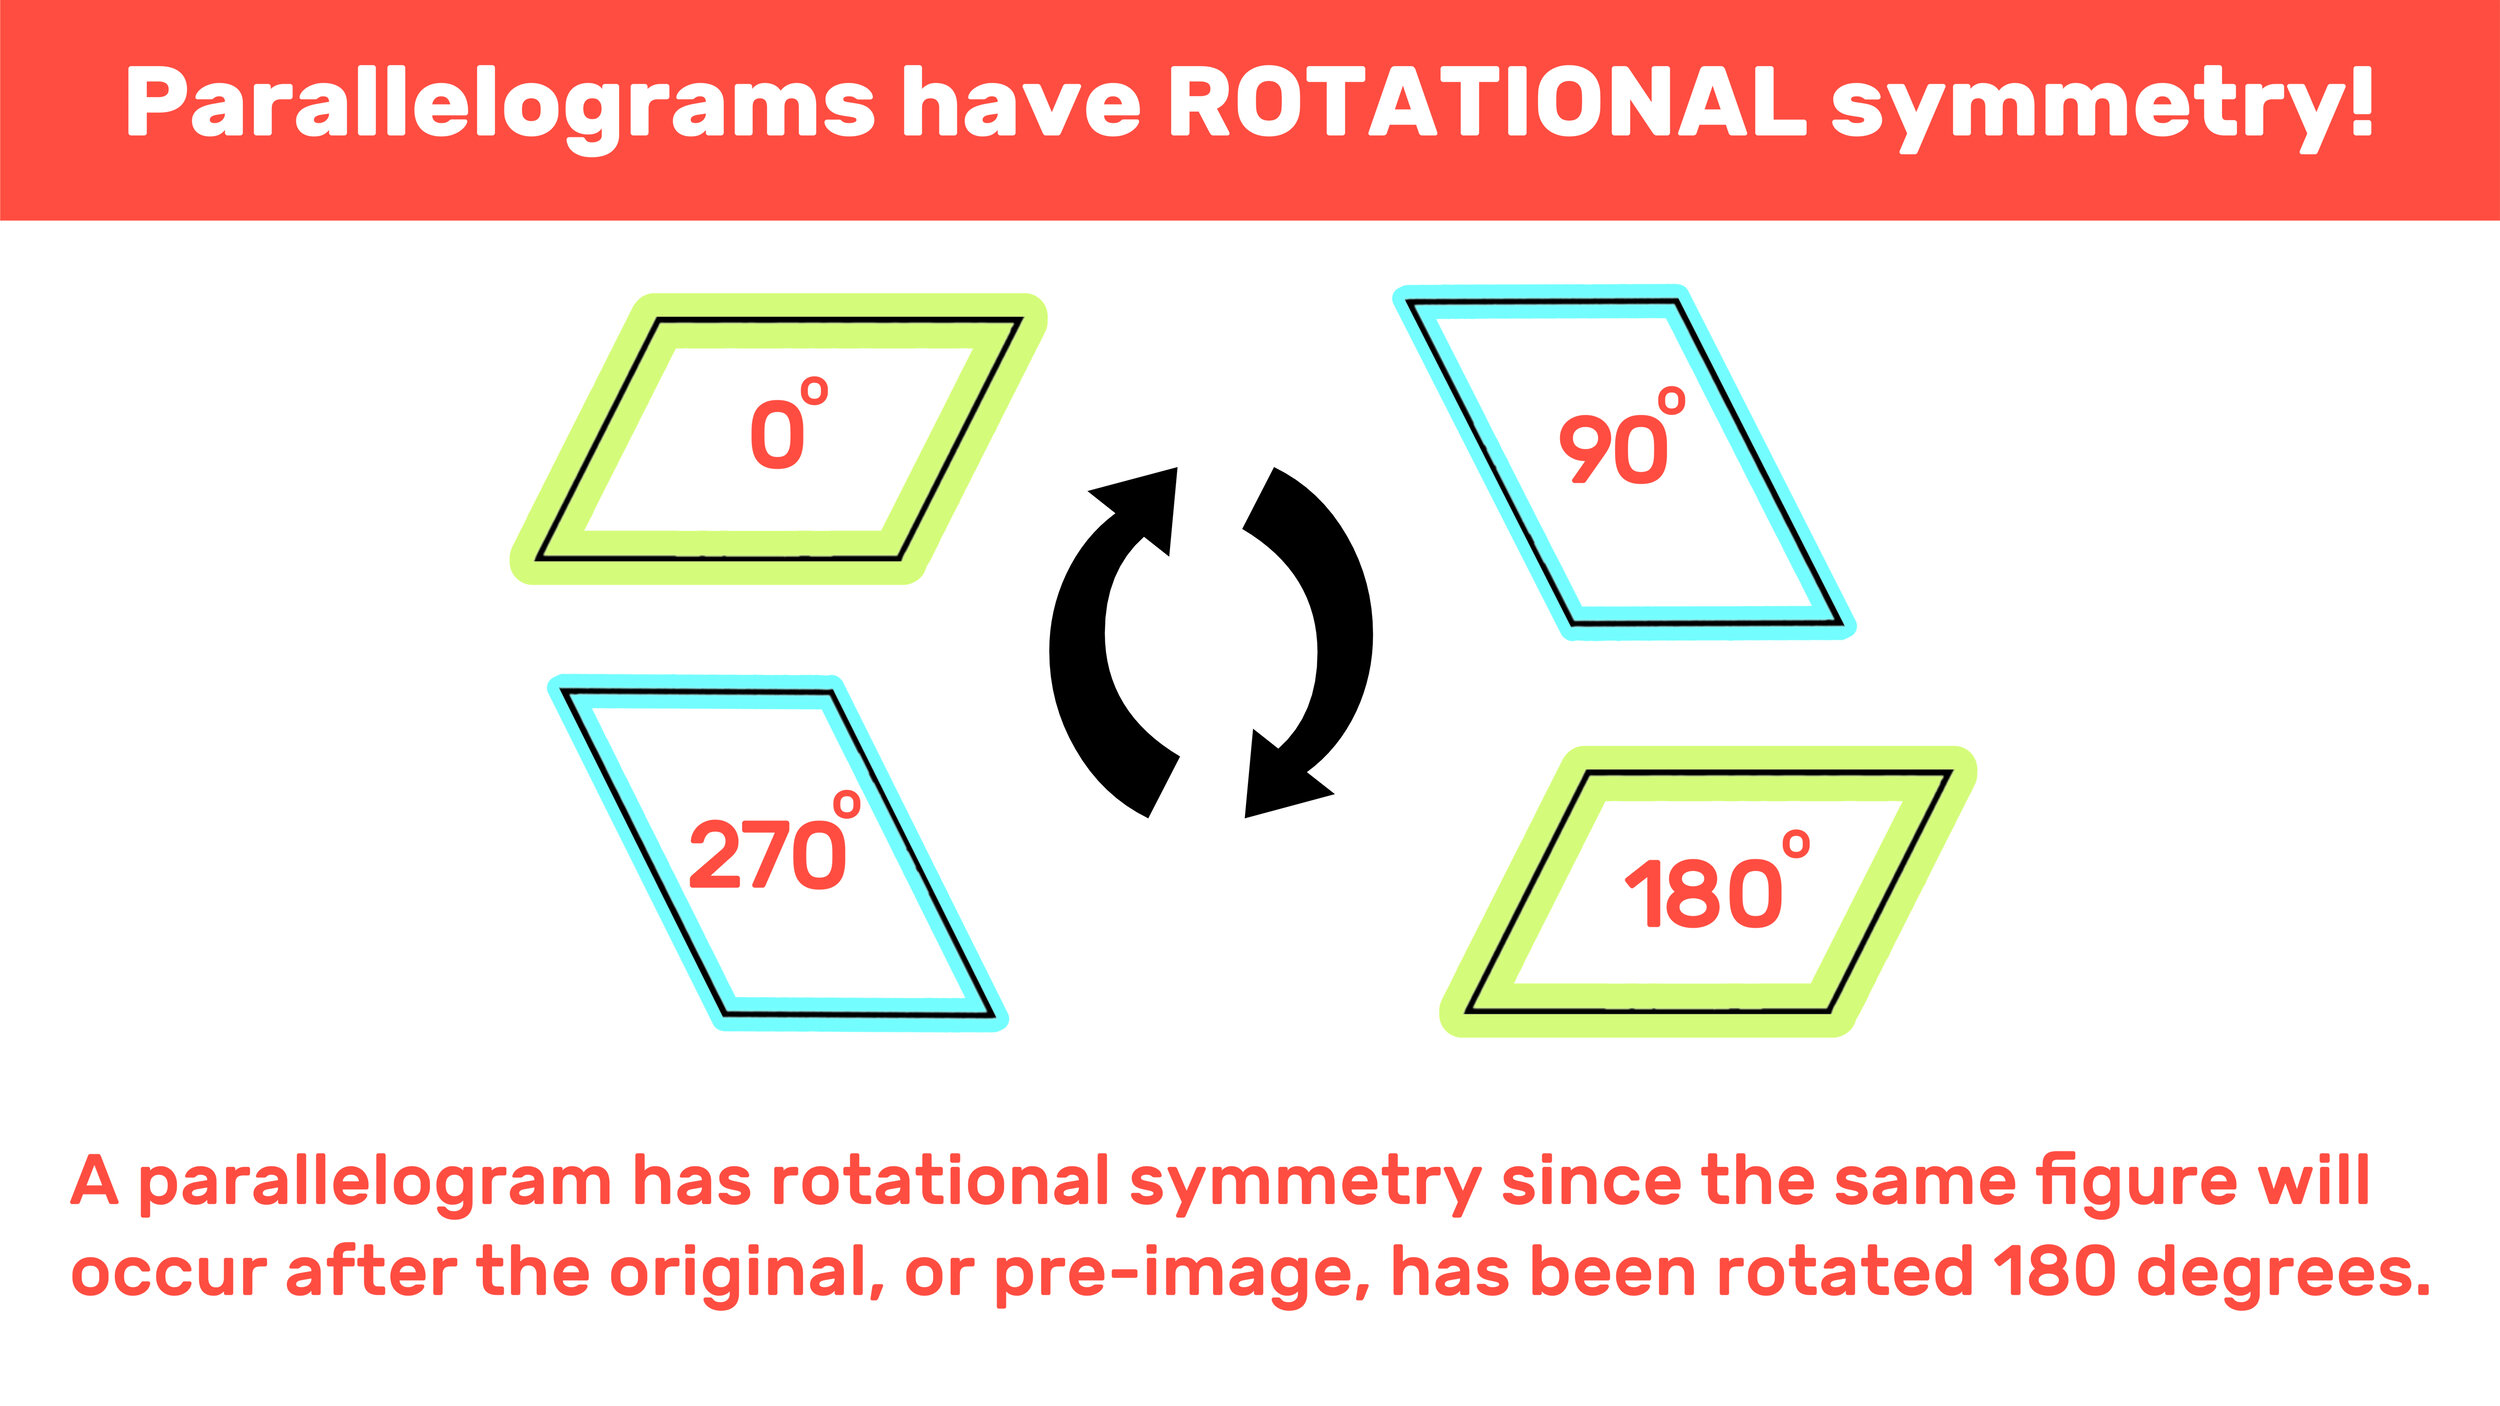
While parallelograms do not have line symmetry, they do have rotational symmetry!

In geometry, rotational symmetry refers to when a shape or figure is exactly the same as its pre-image after it has been rotated a number of degrees.

A parallelogram has rotational symmetry since the same figure will occur after the original, or pre-image, has been rotated 180 degrees.

The figure below further illustrates why parallelograms have rotational symmetry.

ROtational.jpg

 Conclusion

In today’s lesson, we explored parallelogram lines of symmetry, whether or not they exist, and whether or not parallelograms have any symmetry at all.

 After reviewing the properties of parallelograms, namely that they are quadrilaterals where the opposite sides and opposite angles are equal, we went on to determine whether or not parallelograms have any line symmetry.

By applying the definition of a line of symmetry, we concluded that, while shapes like squares and rectangles do indeed have lines of symmetry, that parallelograms do not have any lines of symmetry.

Parallelograms have zero lines of symmetry because it is impossible to draw a line through the center of any parallelogram that divides the figure into two equal halves that are mirror images of each other.

However, even though parallelograms do not have line symmetry, they do have rotational symmetry since any parallelogram, after a rotation of 180 degrees, will result in the exact same image as you started with.

Share your thoughts, questions, and suggestions in the comments section below!

(Never miss a Mashup Math blog--click here to get our weekly newsletter!)

By Anthony Persico

Anthony is the content crafter and head educator for YouTube's MashUp Math and an advisor to Amazon Education's 'With Math I Can' Campaign. You can often find me happily developing animated math lessons to share on my YouTube channel . Or spending way too much time at the gym or playing on my phone.

You Might Also Like…

1 Comment

11 Super Funny Pi Jokes for All Ages!

Comment

11 Super Funny Pi Jokes for All Ages!

PiParty.jpg

11 Supper Funny Pi Jokes

Can you never get enough super funny Pi jokes related to most famous symbol in all of mathematics?

 (Did you hear the one about the mathematicians ordering takeout on March 14th ….. They got chicken pot pi!)

In math, pi—which is portrayed as the Greek symbol π—represents the ratio of the circumference of any circle to its diameter, which is often approximated to 3.14 (although the actual number is irrational and continues on and on forever).

This relationship is ubiquitous in mathematics and is often celebrated in a variety of ways, including with humor! So, if you can’t get enough of celebrating Pi, whether its Pi Day (celebrated on March 14th each year) or not, then you will absolutely love this collection of some of the funniest pi jokes and pi puns you’ve ever seen!

Today’s post shares a collection of our eleven favorite (and funniest) pi jokes. Each joke is a sample from our wacky math joke book Super Silly Math Jokes for Kids!, which includes 150+ silly math jokes for all ages. If you love math humor, then you will absolutely love the book.

Now is your best chance to discover the best pi jokes and pi puns on the internet all in one place! Go ahead and add them to your math joke collection and use them to get a big chuckle out of your friends and classmates and to impress your math teachers and professors. Because, whether it’s pi day or not, sharing funny, silly, and sometimes wacky pi jokes is a great way to add some humor to your life—especially if you love mathematics as much as we do!

The list of pi jokes below shares each joke in two parts: first, the opener and, second, the punchline. You will notice that the opener of each joke is shown in bold text, while the punchline is shown in regular italic text. Each pi joke also includes a fun image graphic (in a cartoon style) that portrays each joke like a comic. You are encouraged to share this post and/or your favorite joke on Facebook and Twitter!

And now for the big moment…are you ready to laugh so hard that your sides will hurt and milk will shoot out of your nose?

Whenever you are ready to start laughing, go ahead and scroll down to see all of our pi jokes!

11 Super Funny Pi Jokes

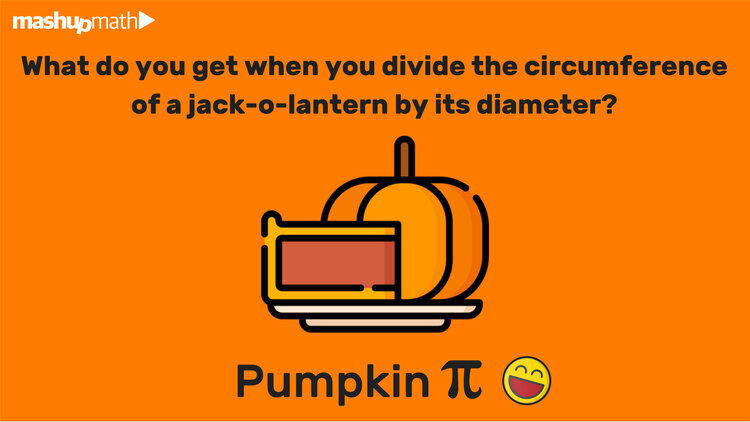
1.) What do you get when you divide the circumference of a jack-o-lantern by its diameter?

Pumpkin Pi!

PumpkinPi.jpg

2.) What do you call a mathematician who becomes a private investigator?

Magnum Pi

PiMagnum.jpg

3.) What is the most mathematical type of snake?

A Pi-Thon!

PiTHon.jpg

4.) Where does a dough-shaped disc topped with melted cheese and seasoned tomato sauce with a radius of z and a depth of a get its name from?

Pizza ( Pi x z x z x a )

PizzaMath.jpg

5.) What subset makes up 3.14% of sailors?

Pi-rates

PiRates.jpg

6.) What do mathematicians eat for dinner on March 14th?

Chicken Pot Pi

PotPi.jpg

7.) What do mathematicians and the Air Force have in common?

They both use pi-lots!

PiLots.png

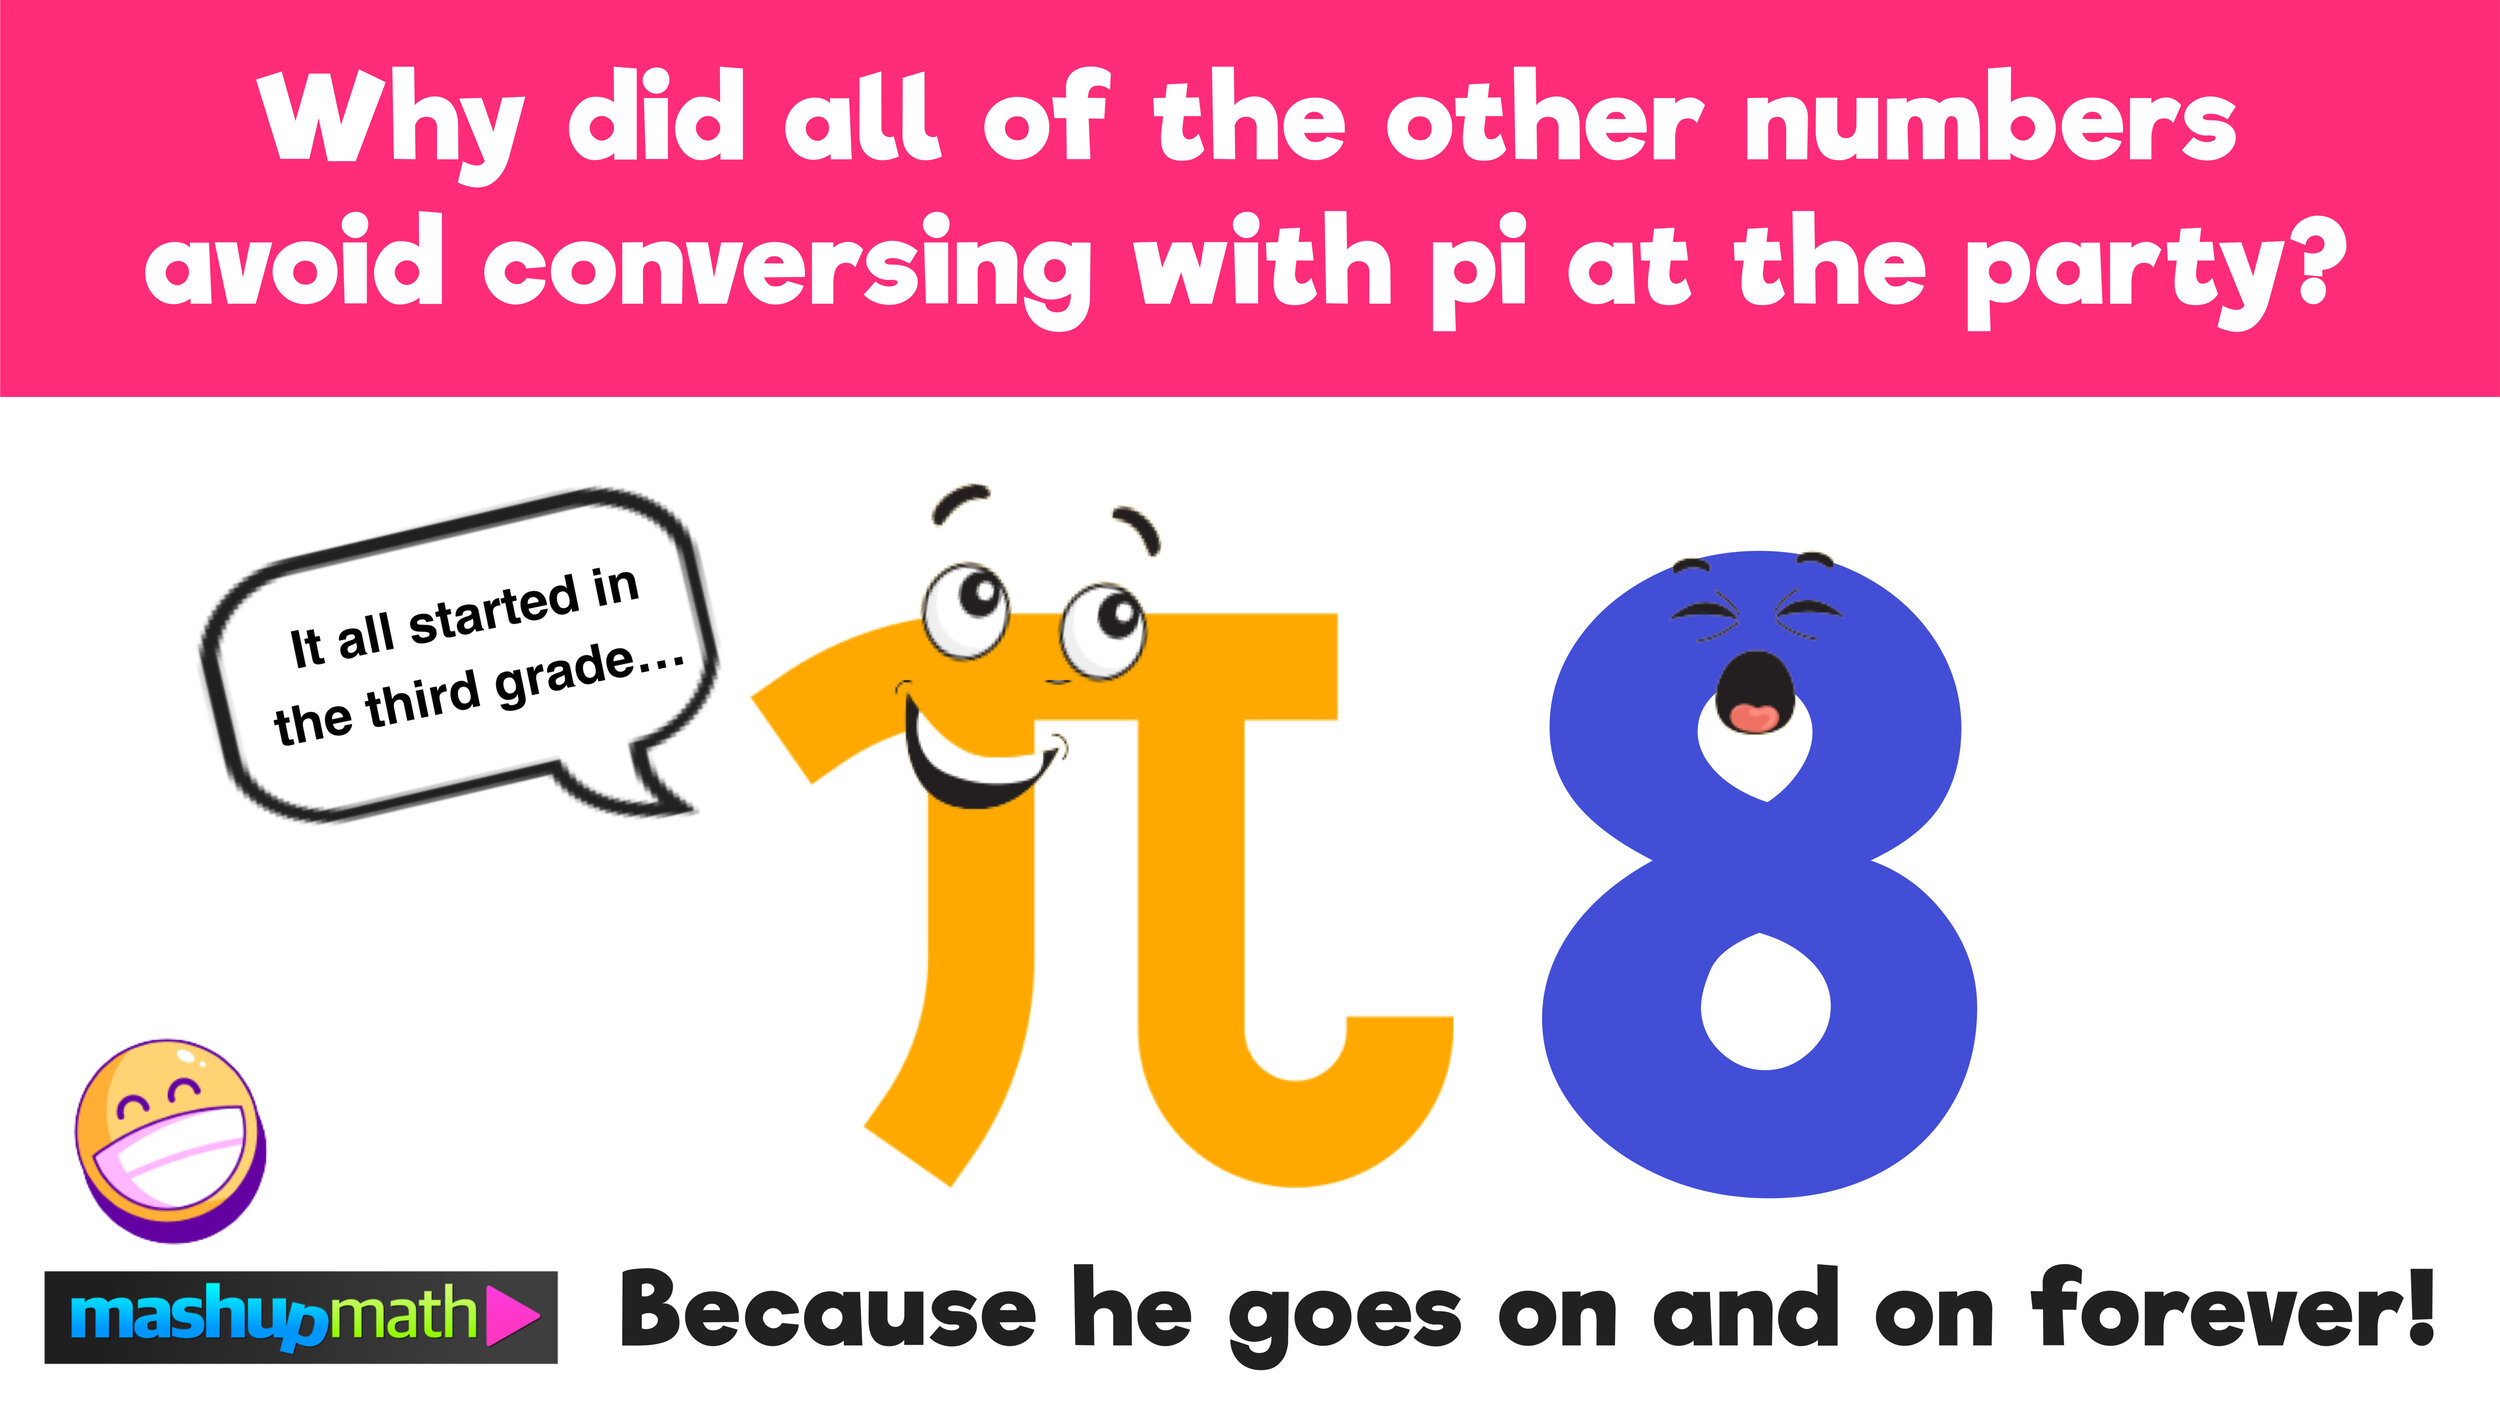
8.) Why did all of the other numbers avoid conversing with pi at the party?

Because he goes on and on forever!

PiParty.jpg

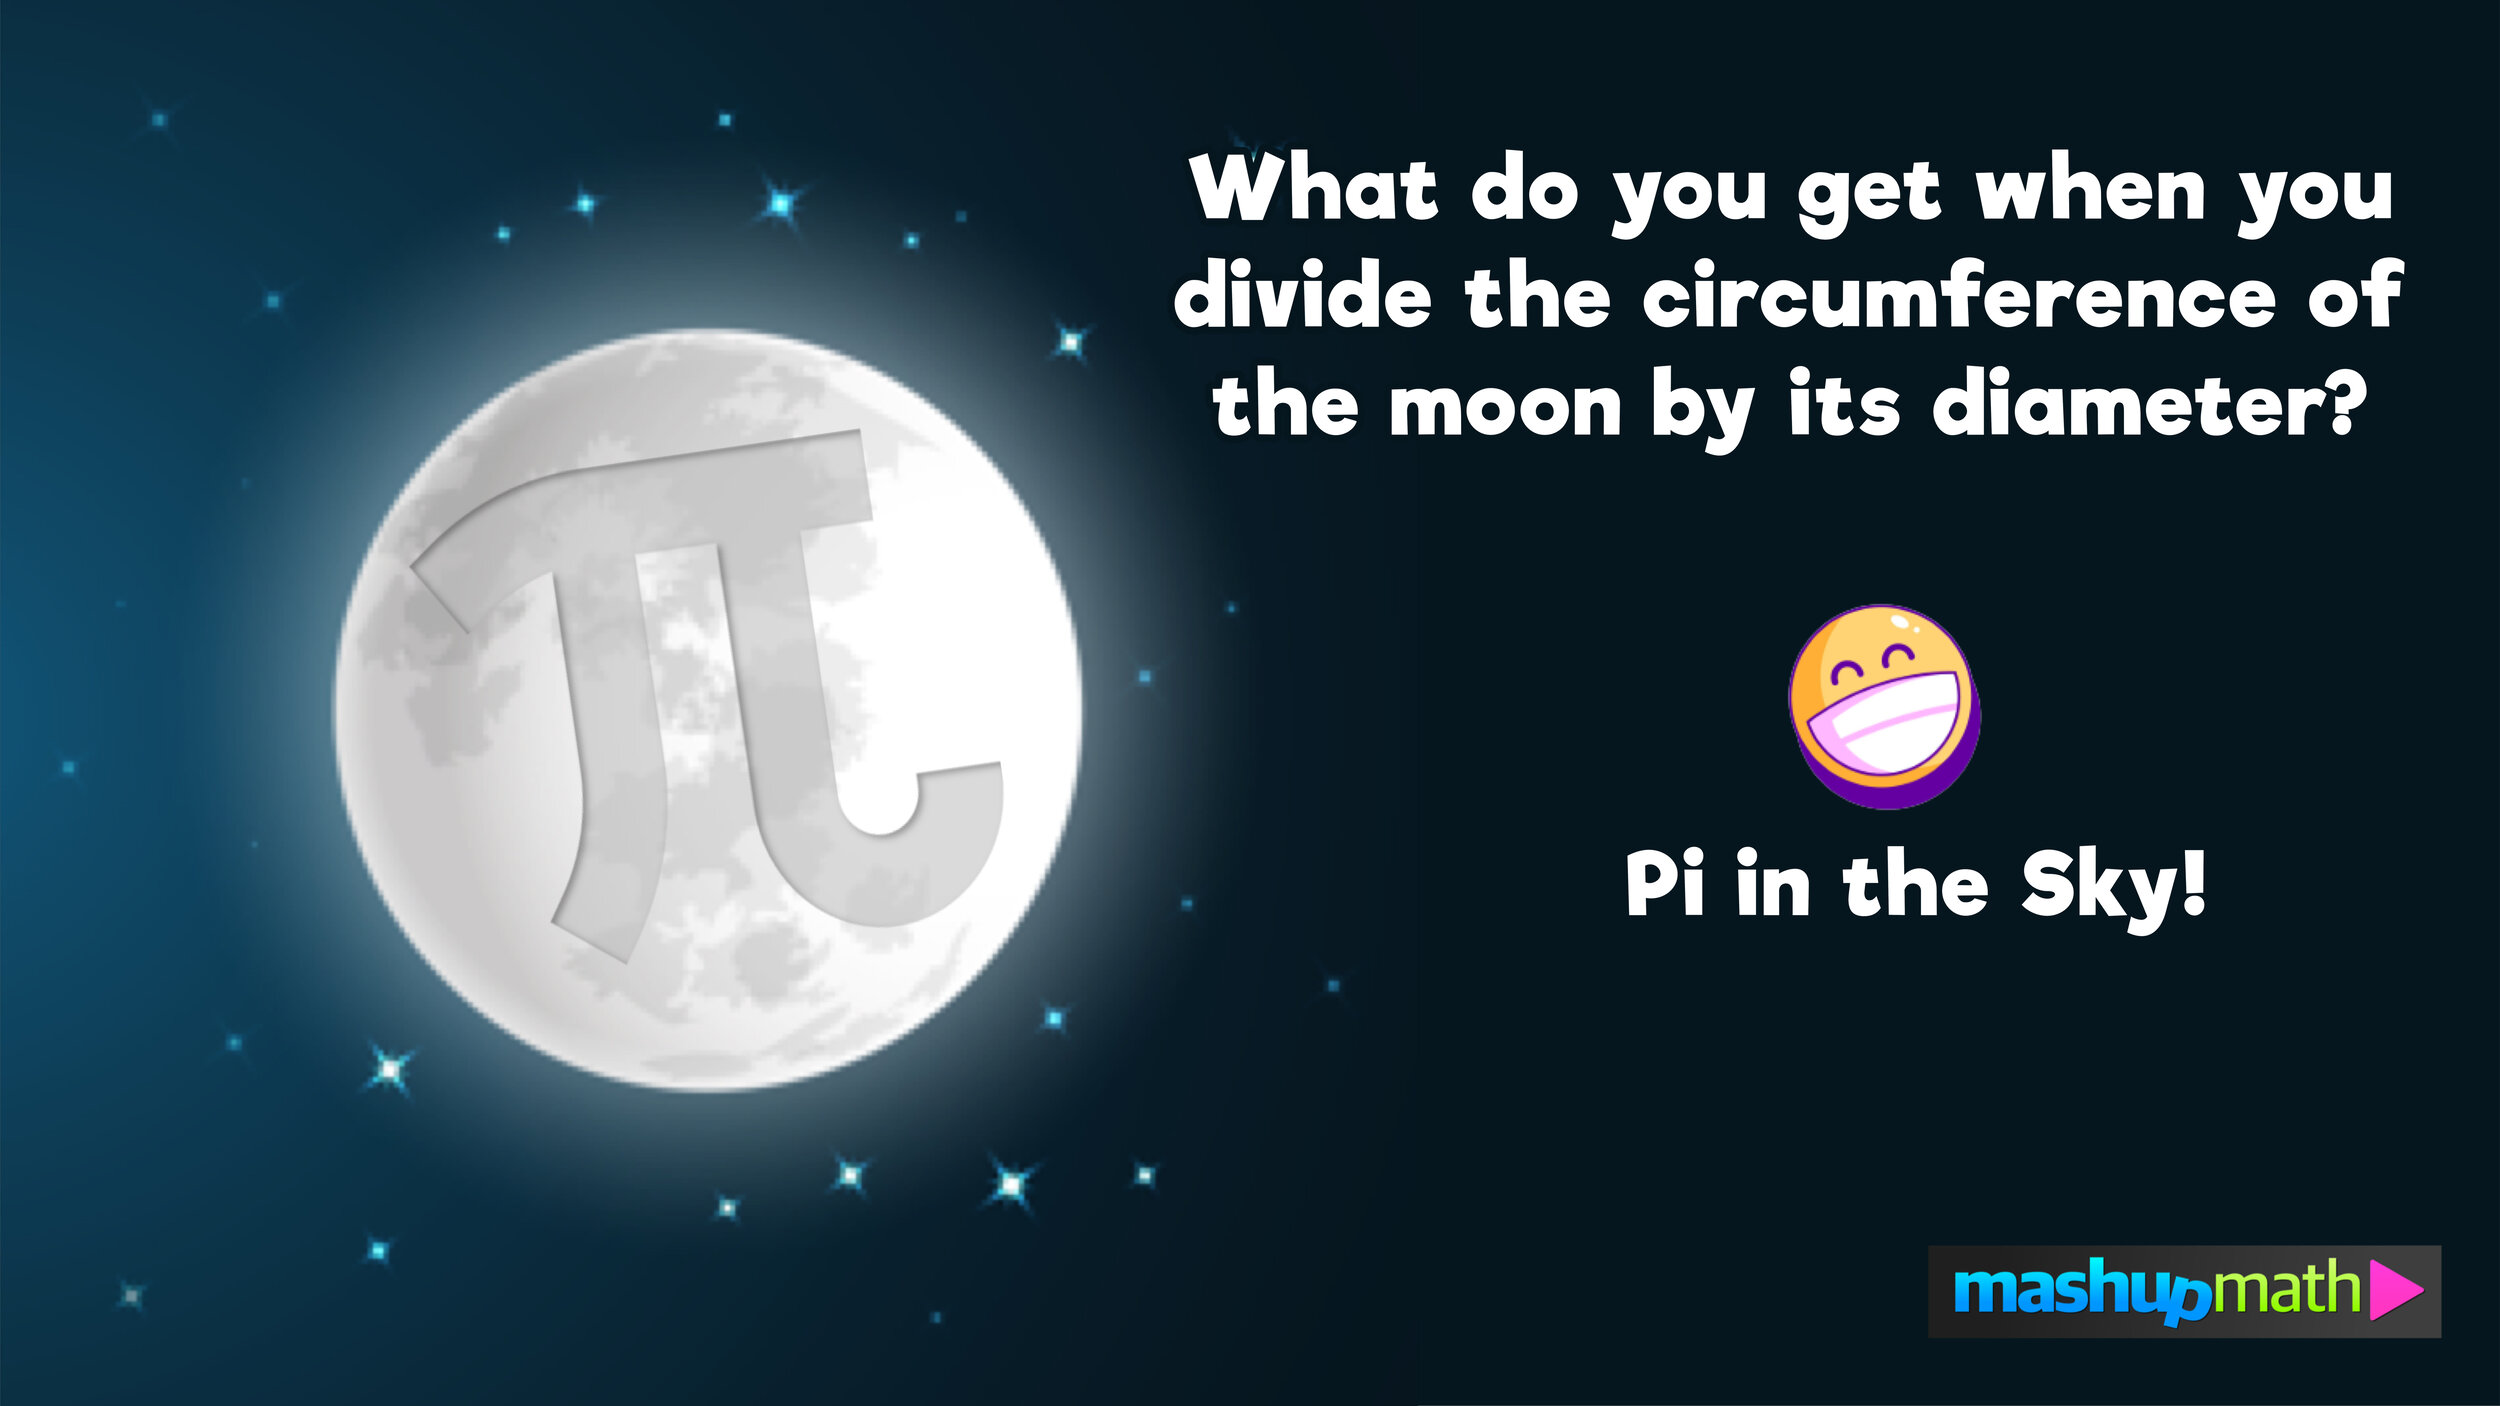
9.) What do you get when you divide the circumference of the moon by its diameter?

Pi in the sky!

Sku.jpg

10.) What happens when you eat less pi and focus on diet and exercise?

You get a smaller circumference!

Circum.jpg

11.) Why should you never argue with pi?

He’s completely irrational!

improper.jpg

Want More Funny Math Jokes?

Then you’ll love this ultimate collection of the funniest, zaniest, wackiest, and silliest math jokes and puns for all ages! Click here to get your math jokes today!


More Posts You Will Enjoy:


Did we miss your favorite geometry joke, math pun, or math humor idea? Share your thoughts and suggestions in the comments section below!

(Never miss a Mashup Math blog--click here to get our weekly newsletter!)

Comment