How to Find Slope on a Graph in 3 Easy Steps

Comment

How to Find Slope on a Graph in 3 Easy Steps

How to Find Slope on a Graph

Step-by-Step Guide: How to Find a Slope on a Graph by Following 3 Simple Steps


Step-by-Step Guide: How to find slope on a graph explained.


In algebra, you will often be working with linear functions of the form y=mx+b where m represents the slope and b represents the y-intercept.

When it comes to dealing with these types of linear functions on the coordinate plane, you can find figure out the slope of the line simply by analyzing its graph. This particular skill will be the focus of the free step-by-step guide, where we will learn how to find slope on a graph using a simple 3 step strategy.

This free guide on How to Find a Slope on a Graph will teach you everything you need to know about finding the slope of a line on a graph and this skill can be used to solve any problem that requires you to find the slope of a linear function graphed on the coordinate plane.

This guide will cover the following topics/sections:

You can use the hyper-links above to jump to a particular section of this guide, or you can work through each section in order (this approach is highly recommended if you are learning this skill for the first time).

Are you ready to get started? Let’s begin with a quick review of slope.


Preview: In this guide, we will learn to use “rise over run” to find slope on a graph.


Quick Review—What is Slope?

Before we get into any examples of how to find a slope on a graph, it’s important that you understand the concept of slope and what it means.

Definition: The slope of a line refers to the direction and steepness of the line.

Slope is often expressed as a fraction where the numerator represents the vertical change (the change in y-position) and the denominator represents the horizontal change (the change in x-position). When a slope is a whole number, you can think of it as having a denominator of 1 (for example, a line with a slope of 4 actually has a slope of 4/1).

There are four types of slope:

  • Positive Slope ↗️: Lines that increase from left to right have a positive slope.

  • Negative Slope ↘️: Lines that decrease from left to right have a negative slope.

  • Zero Slope ↔️: Horizontal lines have a slope of zero.

  • Undefined Slope ↕️: Vertical lines have an undefined slope.

Since we will be dealing with finding slope on a graph in this guide, it is important that you are familiar with what these four kinds of slope look like. Before moving forward, take a close look Figure 01 below, which illustrates examples of these four kinds of slope.


Figure 01: There are four types of slope on a graph: positive, negative, zero, and undefined.


We often refer to slope in terms of “rise over run” where rise refers to the line’s vertical behavior and run refers to the line’s horizontal behavior.

In this guide, we will use “rise over run” to help us to find a slope on a graph.

So, how does “rise over run” work?

Let’s consider the graph in Figure 02 below.


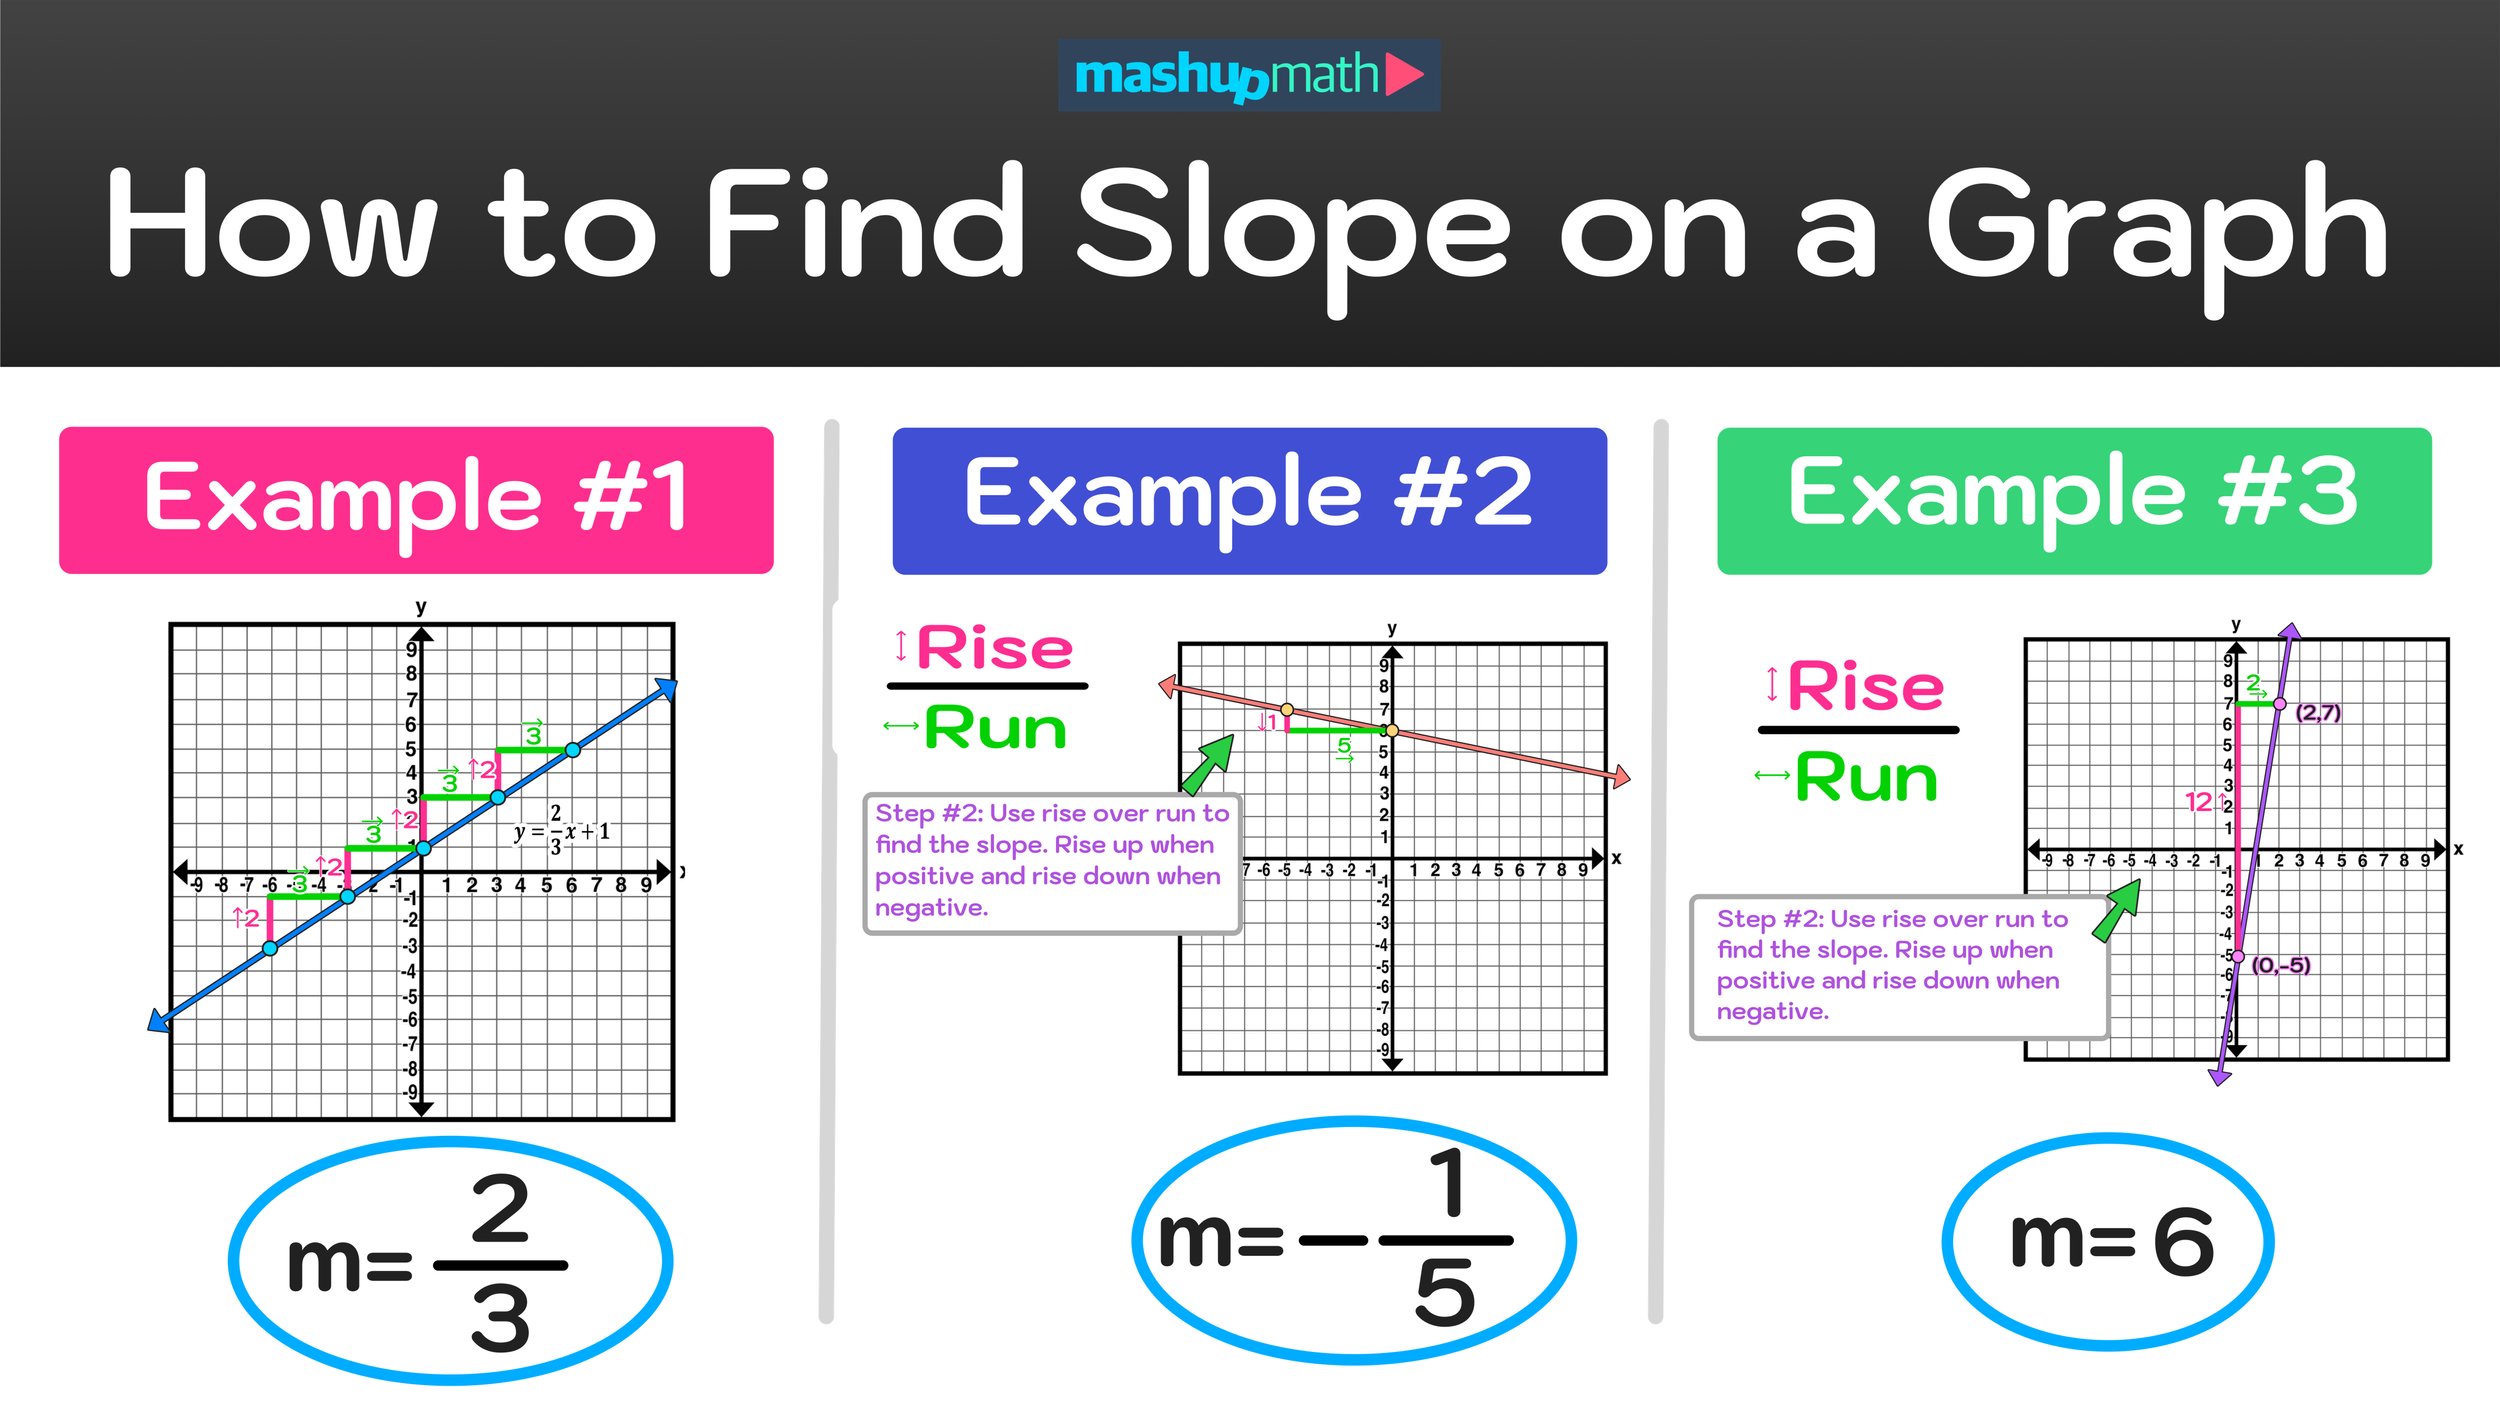
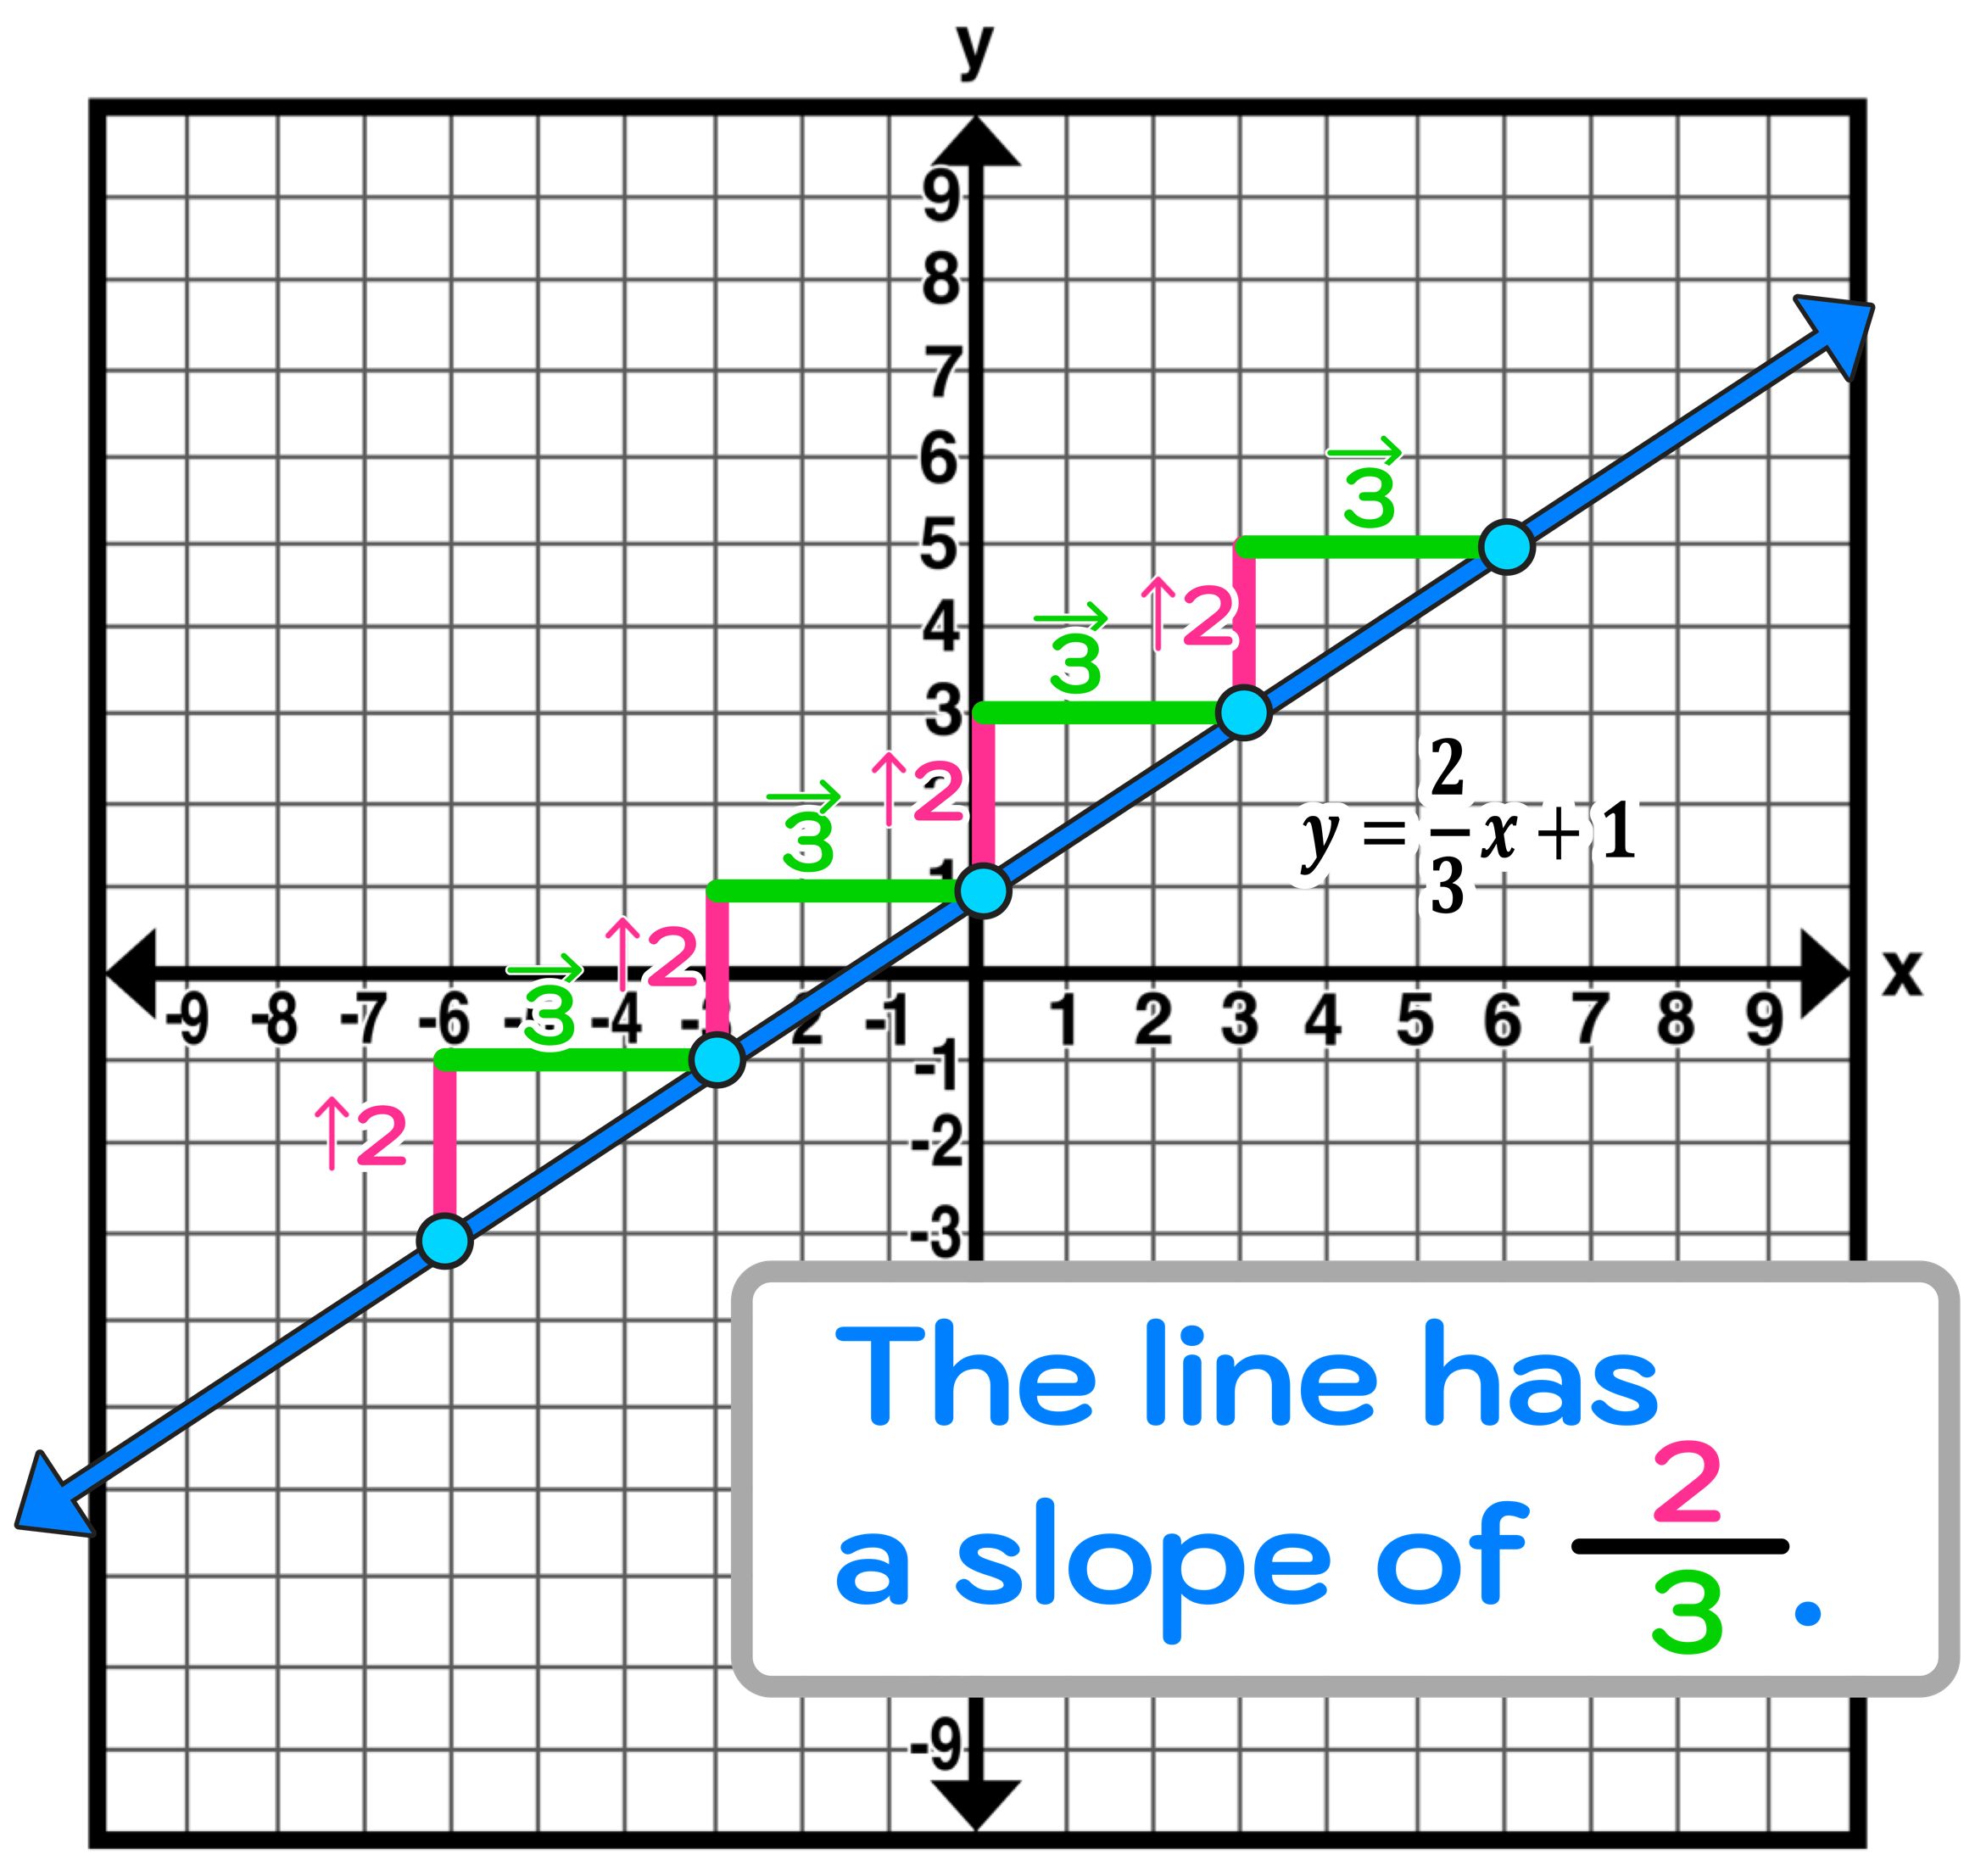
Figure 02: How can we find the slope of the line y=2/3x+1 on the graph using rise over run?


First, we are given the graph of the line that represents the equation y=2/3x+1.

By looking at this graph, you can see that the line is increasing from left to right, so we know that the slope will be positive.

Also, notice that, in this case, we are given the equation of the line in y=mx+b form: y=2/3x+1, so we should already know that the slope will equal 2/3.

But, what if we just given the graph of the line without the equation? How then could we find the slope of the graph?

This is where rise over run comes into play. When you have a graph with at least two known points on the graph, you can use rise over run to “build a staircase” from one point to another to determine the slope of the line (i.e. find the fraction that represents the change in y-position over the change in x-position for the given line).

Figure 03 below illustrates how to use rise over run to build a staircase from point to point to find the slope of the line.


Figure 04: How to find slope of a line on a graph using rise over run.


Notice that our staircase consistently rises upwards two units and then runs 3 units to the right from point to point.

This tells us that the line has a slope of 2/3. And, since 2/3 can’t be simplified or reduced, we can conclude that the line on the graph has a slope of 2/3 (which is positive).

Note that not all slopes will be positive and it won’t always be the case that your resulting rise over run fraction can’t be simplified or reduced (we will see both occurrences in the examples ahead).

The key takeaways here are that:

  • There are four types of slope: positive, negative, zero, and undefined

  • Slope can be expressed as a fraction that represents “change in y” over “change in x”

  • We can rise over run to find the slope of a graph as long as we know at least two points on the graph

Now, let’s go ahead and work through some examples of how to find a slope on a graph using an easy 3 step strategy that utilizes rise over run.


Figure 05: Understanding the difference between positive slopes and negative slopes in reference to rise over run.


How to Find Slope on a Graph

Example #1: Find the Slope of the Graph

For the first example and all of the examples that follow, we will use the following 3-step strategy for how to find a slope on a graph:

  • Step #1: Select two coordinate points on the graph that have integer coordinates and plot them on the line clearly.

  • Step #2: Using rise over run, build a step that connects the two points to find the change in y and the change in x (i.e. the slope of the line).

  • Step #3: Express your answer as a fraction and simplify if possible.

Now, let’s go ahead and dive into this first practice problem where we are given a line and we are tasked with finding its slope.


Figure 06: Find the domain and range of the graph of y=x^2.


All that we are given is a line on the coordinate plane without any points or an equation. However, we can still determine the slope of the graph by applying our 3-steps as follows:

Step #1: Select two coordinate points on the graph that have integer coordinates and plot them on the line clearly.

To complete the first step, look for points where the graph intersects perfectly at a coordinate with integer coordinates (i.e. it crosses a point where four boxes meet). You can several options for this first example, but for this demonstration, we will choose the following points and plot them on the graph:

  • (-5,7) and (0,6)

In Figure 07 below, you can see how we plotted these two points on the line to complete Step #1.


Figure 07: How to Find Slope on a Graph: The first step is to find and plot two points on the line with integer coordinates.


Step #2: Using rise over run, build a step that connects the two points to find the change in y and the change in x (i.e. the slope of the line).

Now we are ready to apply rise over run to find the slope. Starting with the leftmost point, we have to build a step that will connect the two points.

Notice that this line is decreasing from left to right, which means that the line has a negative slope.

Whenever we have a negative slope like the one in this example, we will have to “rise down” when performing rise over run (i.e. move downwards vertically instead of upwards).

The process for completing Step #2 is shown in Figure 08 below.


Figure 08: Since this line has a negative slope (it decreases from left to right), our rise action was in a downwards vertical direction).


Using rise over run, we can see that this negative slope rises downwards 1 unit and to the right 5 units, so we can conclude that the slope is -1/5.

Step #3: Express your answer as a fraction and simplify if possible.

We now have a fraction that represents the slope of this line: m = -1/5.

Since this slope was negative, it needs to include the negative sign. Now, the last step is to check if the fraction -1/5 can be simplified or reduced. Since it can not be, we can conclude that:

Final Answer: The line has a slope of -1/5.

If we were to use this result to “continue the staircase,” we will see that rising down 1 unit and running to the right 5 units from any point on the line will land you on another point on the line (as shown in Figure 09 below).


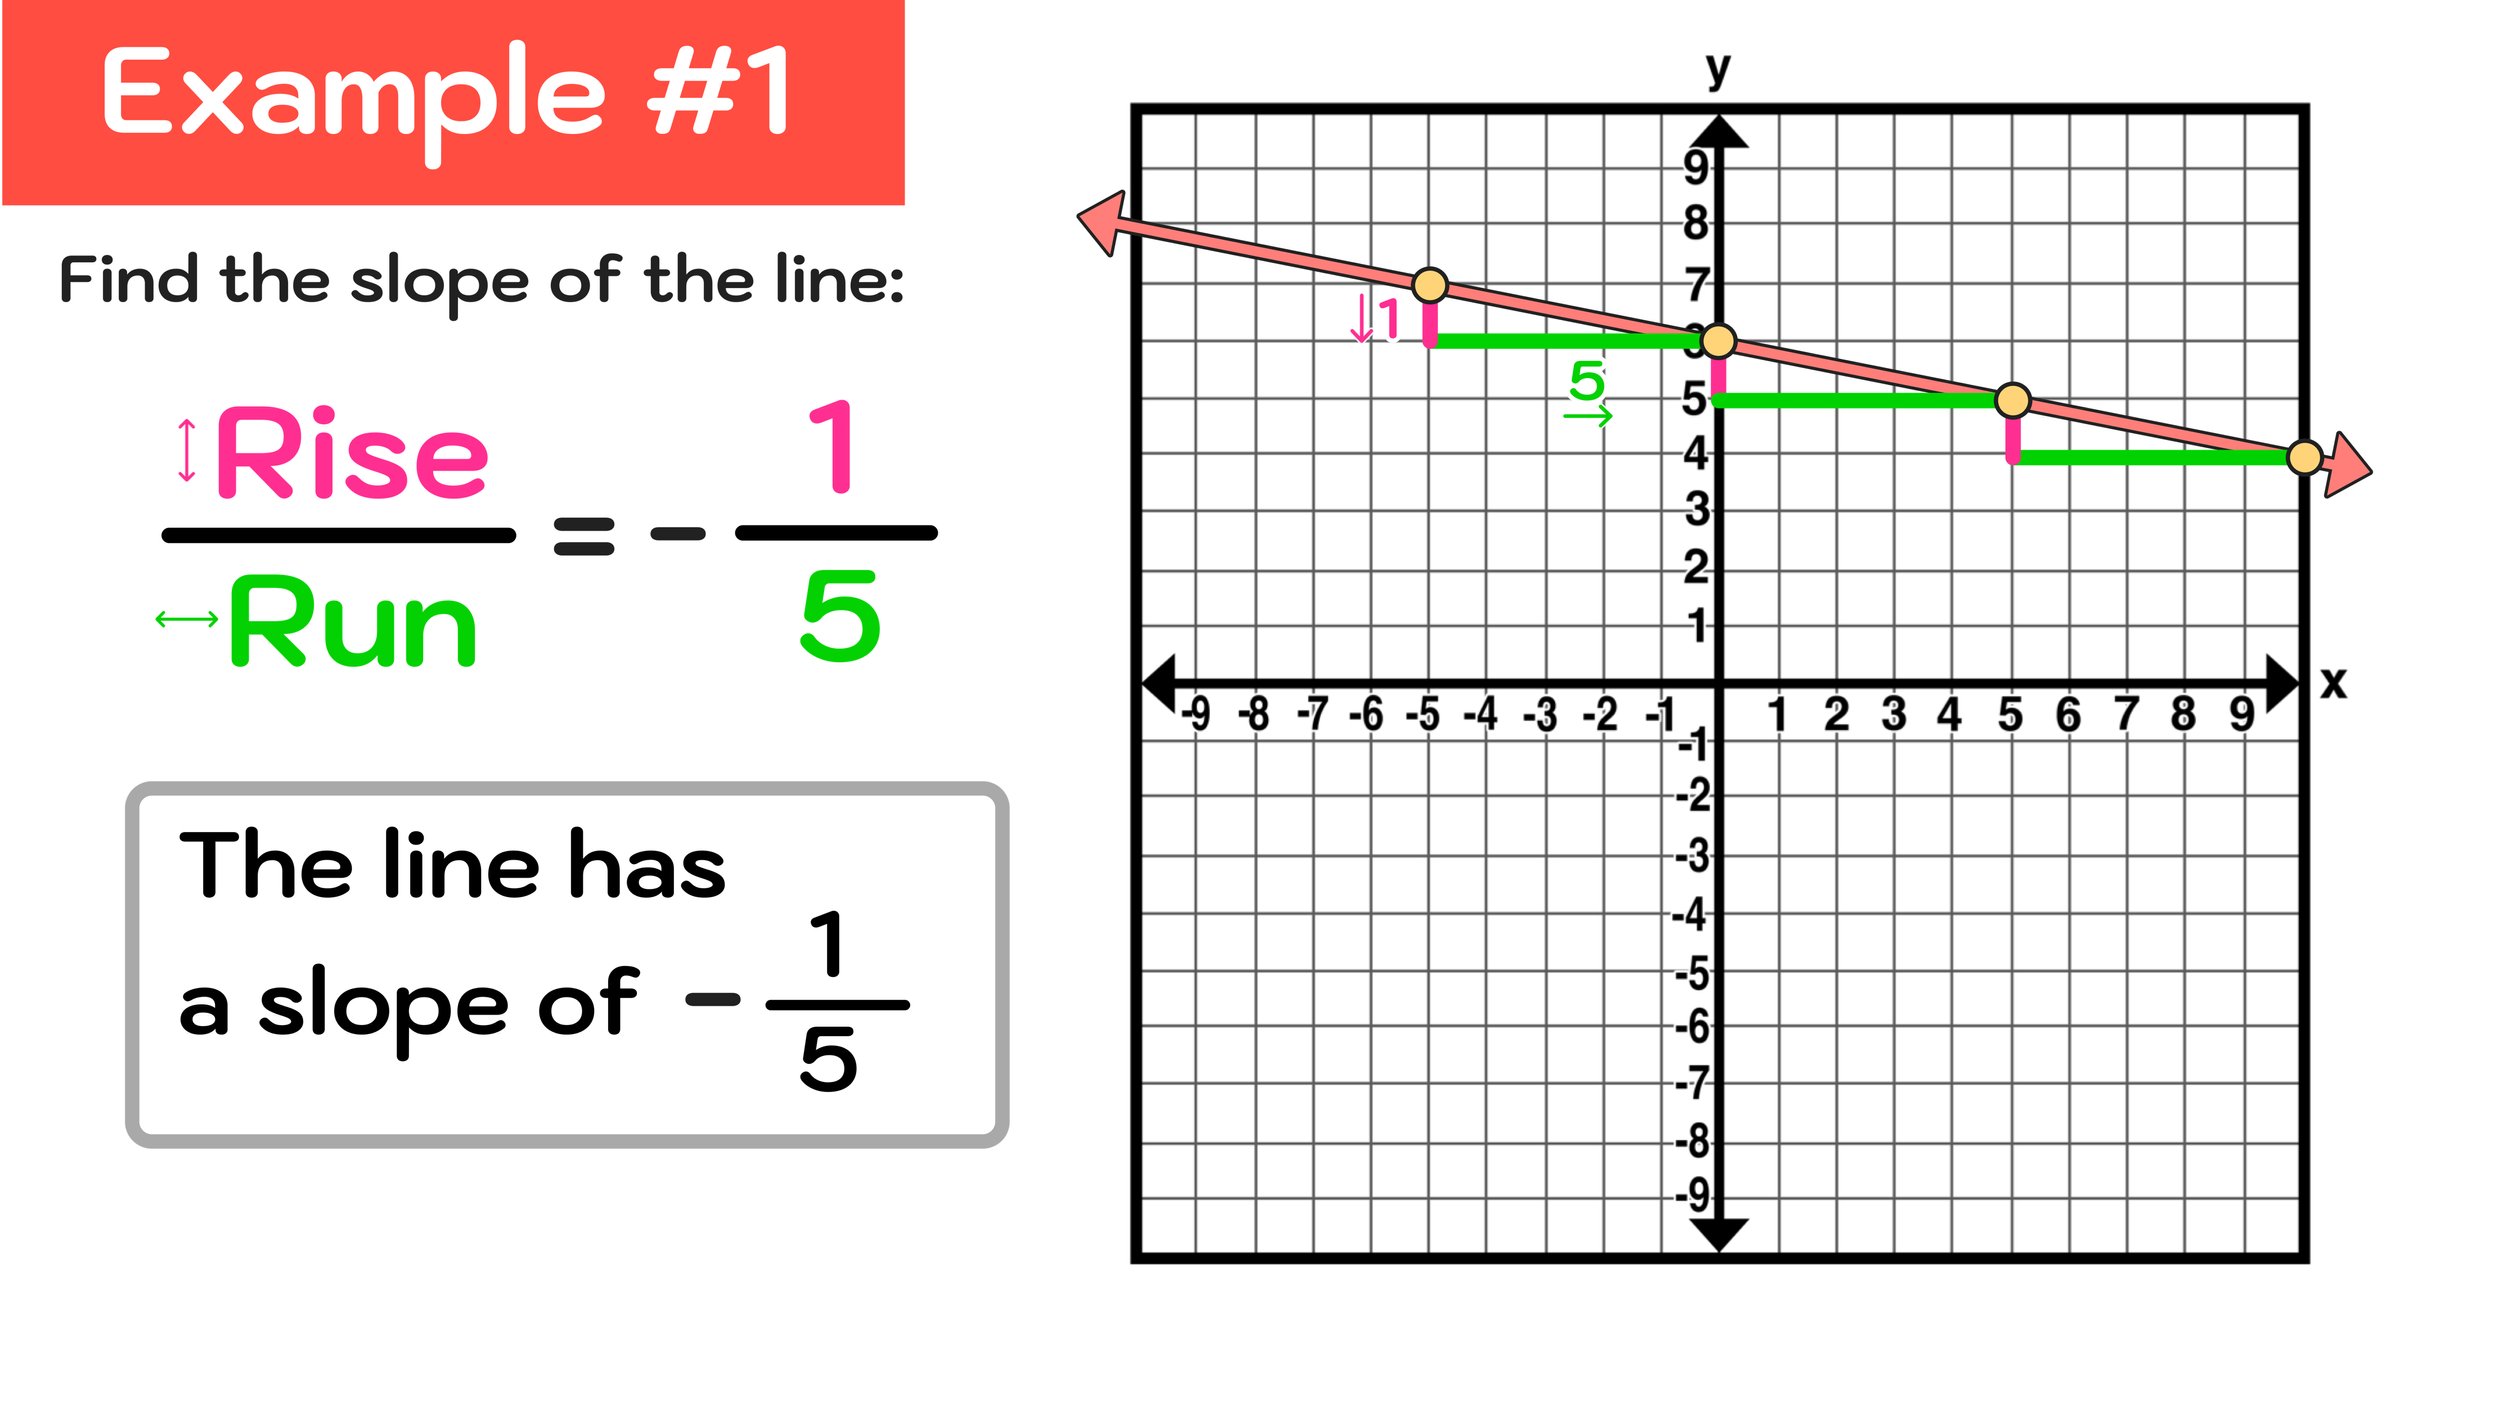
Figure 09: The line has a slope of -1/5.


You can use the 3-step strategy that we used for Example #1 to solve any problem where you have to find slope on a graph without a given equation. Let’s gain more experience with the 3-steps by working through another practice problem.


Example #2: Find the Slope of the Graph

For our next example, we have to find the slope of a graph of a pretty steep line. Notice that this line is increasing from left to right, so the slope will be positive.


Figure 10: How to Find the Slope of a Line on a Graph


Step #1: Select two coordinate points on the graph that have integer coordinates and plot them on the line clearly.

For the first step, let’s go ahead and find two points with integer coordinates that the line passes through. For this practice problem, we will choose the following points on the line:

  • (0,-5) and (2,7)

Then go ahead and plot these points on the graph as shown in Figure 12 below:


Figure 12: To find the slope on a graph, start by plotting two points on the line that have integer coordinates.


Now that we have plotted our two points on the graph, we are ready for the next step.

Step #2: Using rise over run, build a step that connects the two points to find the change in y and the change in x (i.e. the slope of the line).

Next, we have to use rise over run and build a step that connects the two points so we can determine the slope.

Again, since this line is increasing from left to right, we know that the slope will be positive and that, unlike the last example where the slope was negative, we will have to “rise up” when performing rise over run.

Figure 13 below shows how we can use rise over run to get from (0,-5) to (2,7). You can see that the slope, in this case, is 12/2.


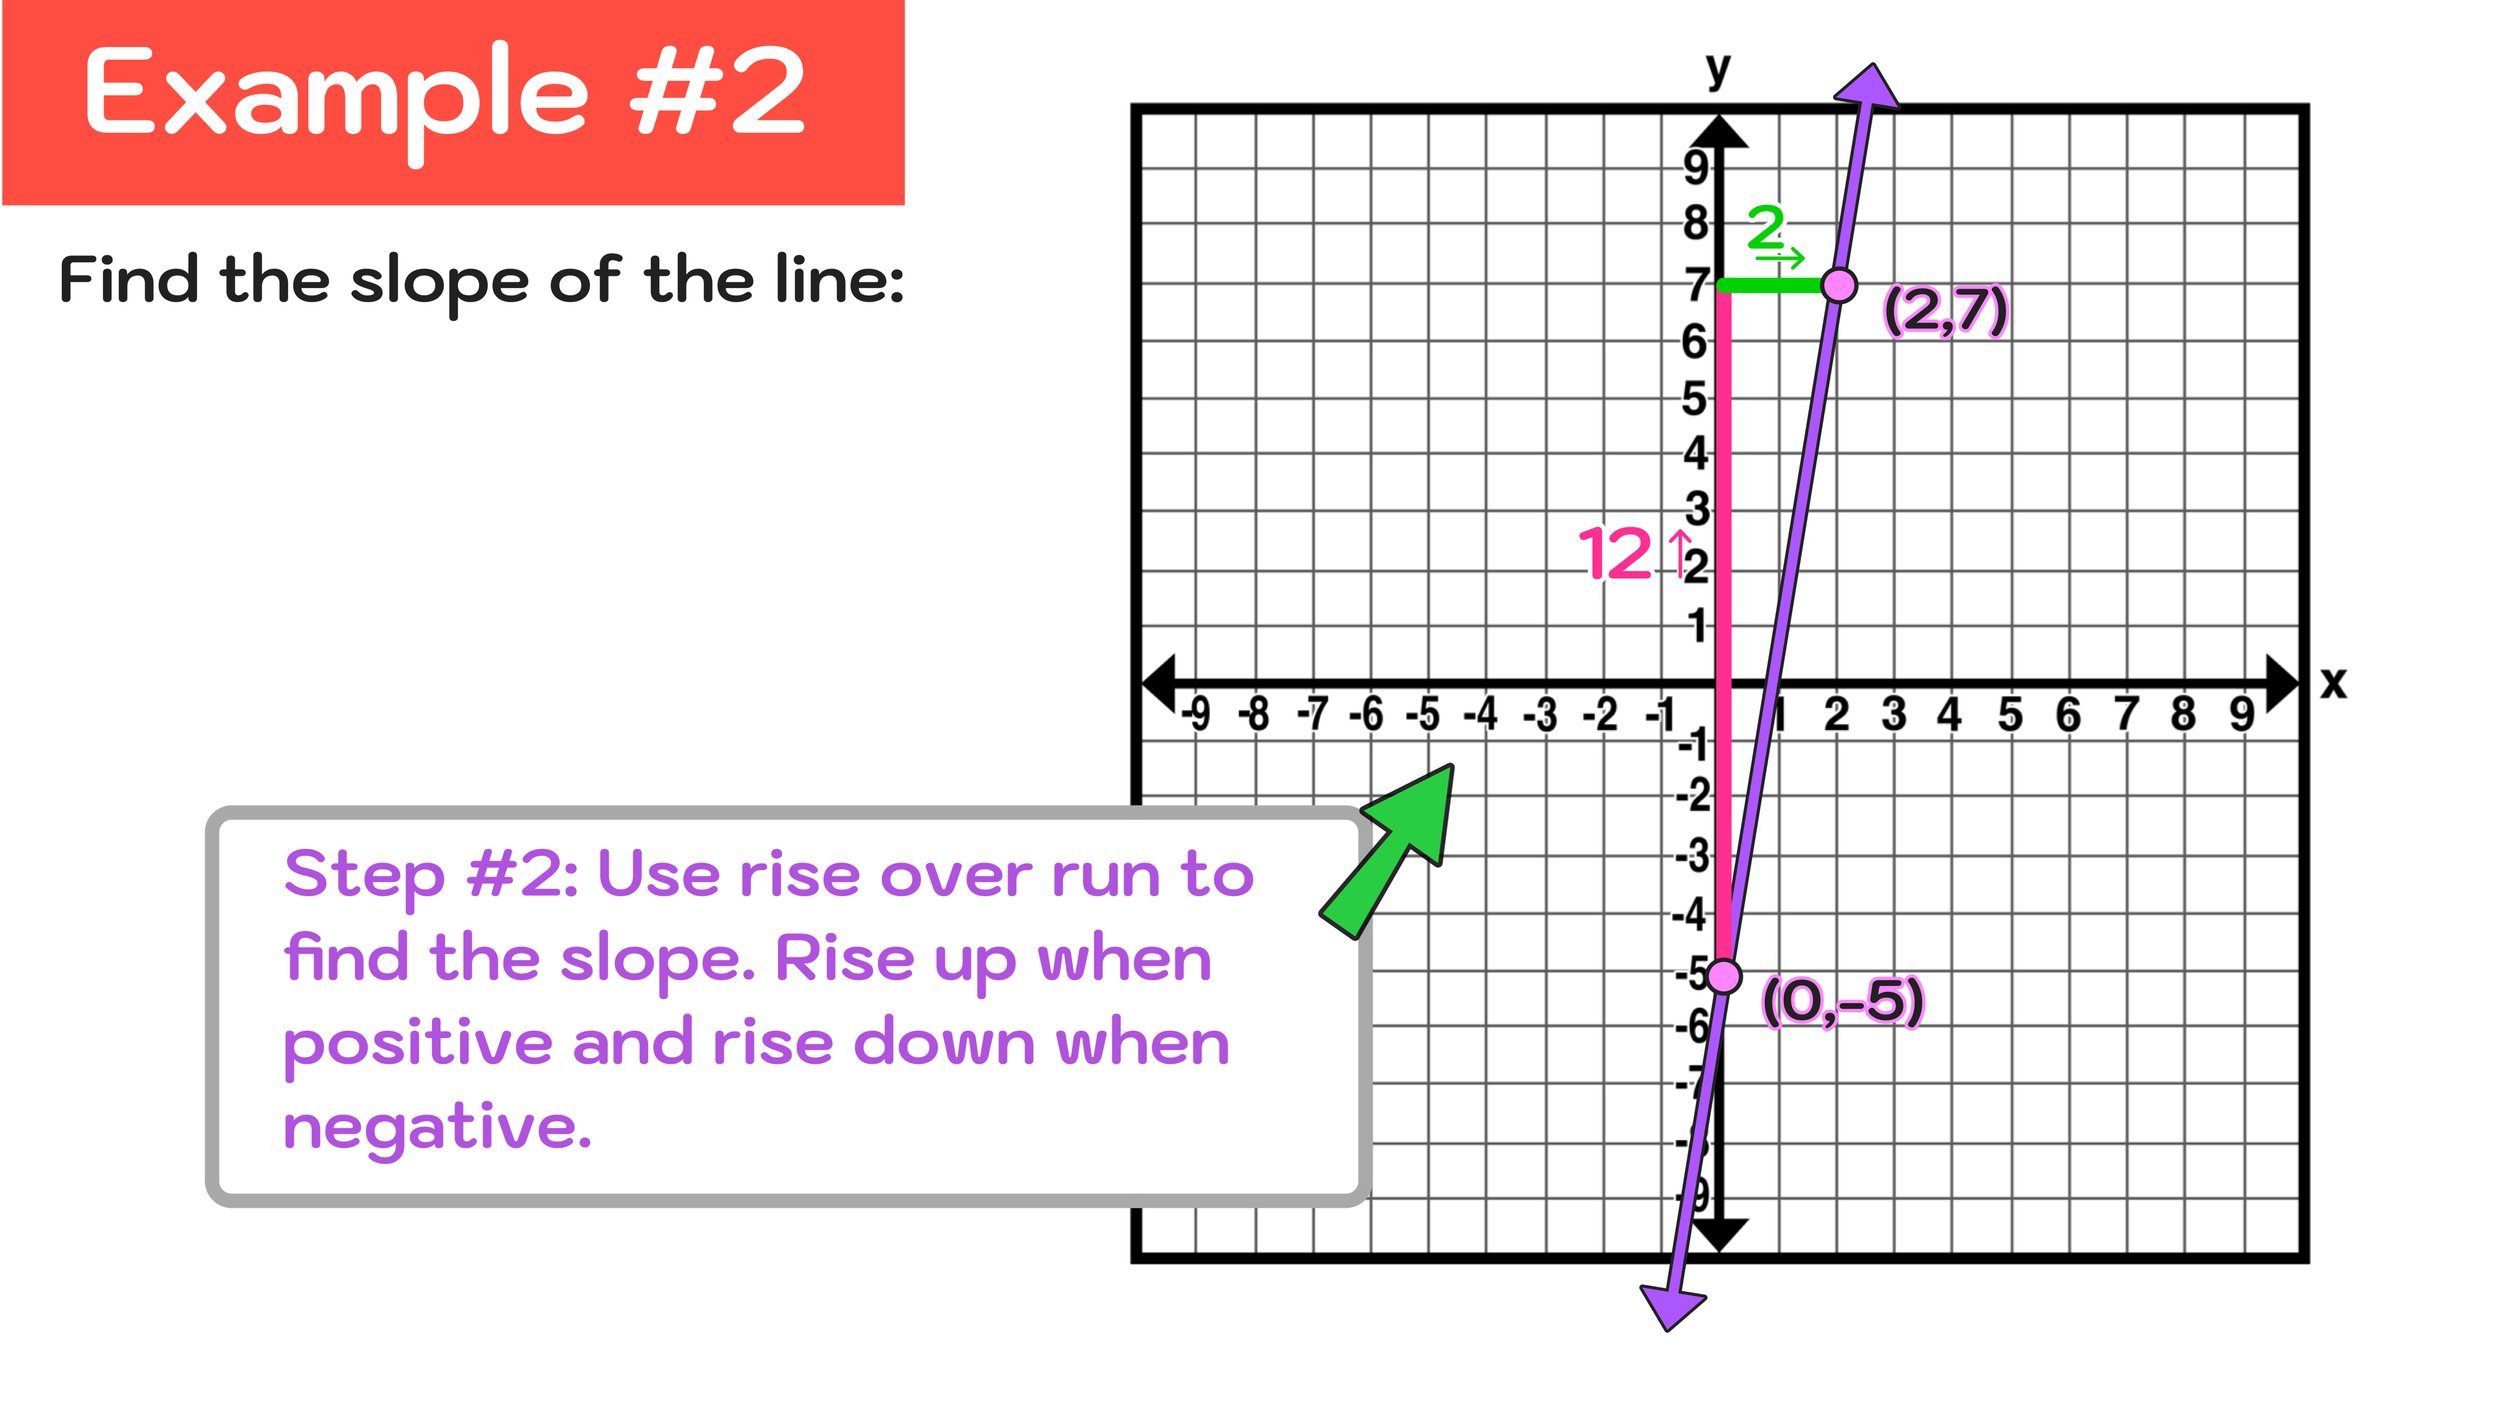
Figure 13: In this case, rise over run gives us a slope of 12/2, but can it be simplified?


After completing Step #2, we can see that the rise was 12 and the run was 2, so we conclude that our slope is: m = 12/2.

Is this our final answer? Let’s perform the third and final step to find out.

Step #3: Express your answer as a fraction and simplify if possible.

Although we have an answer in the form of a fraction, m=12/2, we should know that the fraction 12/2 can be simplified as 6/1 (or just 6).

To say that this line has a slope of 12/2 is not incorrect, but slopes of lines are typically expressed in reduced form.

If we apply our new slope of 6/1 to the point (0,-5) and build our staircase, we will see that the point (1,1) is also on the graph. And, if we continue from that point, we will end up at (2,7), which we know is also a point on the line.

The equivalent relationship between m=12/2 and m=6 is shown in Figure 14 below:


Figure 14: The slope 12/2 can be simplified as 6/1 or just 6.


Final Answer: The line has a slope of 6.

Are you starting to get the hang of it?

Let’s go ahead and take a look at another example.


Example #3: Find the Slope of the Graph

In this third example, let’s take a look at a horizontal line.


Figure 15: How to Find Slope on a Graph: Horizontal Lines


In our review of slope at the start of this guide, we shared that there are four kinds of slope: positive, negative, zero, and undefined.

In the case of horizontal lines, like the line shown on the graph in Figure 15 above, the slope will always be zero.

While we already know that the slope of this line is 0, let’s apply our 3-step method to see if this is actually true.

Step #1: Select two coordinate points on the graph that have integer coordinates and plot them on the line clearly.

You can pick any two points on the line. We will go with:

  • (-4,6) and (5,6)

These points have been plotted on the graph in Figure 16 below:


Figure 16: How to find a slope on a graph: zero slope


Step #2: Using rise over run, build a step that connects the two points to find the change in y and the change in x (i.e. the slope of the line).

Notice that we can not rise or nor rise down since the slope of this line is neither negative nor positive.

Figure 17 below shows how we can use rise over run to get from (-4,6) to (5,6). Since the rise is 0 and the run is 6, we can say that the line has a slope of 0/6.


Figure 17: Horizontal lines have a slope of zero.


Step #3: Express your answer as a fraction and simplify if possible.

After completing Step #2, we know that the rise over run is 0/9, and we also know that 0 divided by 9 is just equal to 0 and we can conclude that:

Final Answer: The line has a slope of 0.


Conclusion: How to Find a Slope on a Graph

The slope of a line refers to the direction and steepness of that line and there are four types of slopes:

  • Positive Slope ↗️

  • Negative Slope ↘️

  • Zero Slope ↔️

  • Undefined Slope ↕️

You can find the slope on a graph of a line by using the rise over run approach and by following the following 3-step strategy:

  • Step #1: Select two coordinate points on the graph that have integer coordinates and plot them on the line clearly.

  • Step #2: Using rise over run, build a step that connects the two points to find the change in y and the change in x (i.e. the slope of the line).

  • Step #3: Express your answer as a fraction and simplify if possible.

You can use these 3 steps to find the slope of any line on a graph, so make sure that you are comfortable using them before moving on. If you feel like you need more help, we recommend going back and working through the practice problems again!

Keep Learning:

How to Find Slope Using the Slope Formula

Your simple step-by-step guide to the formula for slope and how to use it to solve problems.


Comment

How to Find Scale Factor in 3 Easy Steps

Comment

How to Find Scale Factor in 3 Easy Steps

How to Find Scale Factor in 3 Easy Steps

Step-by-Step Guide: How to Find the Scale Factor of a Dilation


Step-by-Step Guide: How to find scale factor of a dilation in 3 easy steps.


When learning about geometry transformations on the coordinate plane, dilations can be tricky since they are the only transformation that involves changing the shape of the original figure. In the case of dilating a figure, we use something called scale factor to determine whether to stretch a figure (make it larger) or shrink a figure (make it smaller) as well as by what factor.

This free step-by-step guide on How to Find Scale Factor in 3 Easy Steps will teach you how to determine the scale factor of a given dilation by looking at its graph and/or a given set of coordinate points.

This guide will cover the following topics:

You can use the quick-links above to skip to any section of this guide. However, if are new to finding the scale factor a dilation, we recommend working through each section in order.

Now, let’s start off with a quick review of dilations and the definition of scale factor.


Figure 01: This guide will teach you how to find the scale factor of a dilation.


What is a Dilation?

Before we learn how to find the scale factor of a dilation, it’s important that we understand what a dilation is in the first place.

There are four types of transformations in geometry:

  • Rotations: When you turn the object clockwise or counter-clockwise about a given point

  • Reflections: When you create a mirror image of the original shape across a line of symmetry

  • Translations: When you slide a figure from one location on the coordinate plan to another

  • Dilations: When you stretch or shrink the image of a figure based on a given scale factor

This guide will focus on the fourth type of transformation—dilations.

Definition: Dilation

In math, a dilation refers to a transformation that results in a figure changing in size, but not shape. This means that the new figure will be made larger or smaller to the original figure, but it will remain proportional.


Figure 02: ▵A’B’C’ is formed after dilating ▵ABC by a scale factor greater than one.


Figure 02 above illustrates an example of a dilation where the image of ▵ABC is being stretched to form the new larger ▵A’B’C’.

Notice, however, that both triangles have the same shape and are proportional to each other. ▵A’B’C’ is just a scaled up version of ▵ABC.

What is Scale Factor?

Definition: Scale Factor

Every dilation is based on a scale factor, which we will denote using the letter k in this guide.

In math, a scale factor refers to the ratio between the side lengths and coordinate points of two similar figures. In the case of dilations, scale factor is used to describe by what factor the original image has been stretched (enlarged) or shrunk (reduced) in size.

When the scale factor, k, is greater than one, the result is an enlargement. When the scale factor, k, is less than one, the result is a reduction.

Figure 03 illustrates the relationship between an image and its scale factor in terms of the new image being larger or smaller.


Figure 03: When the scale factor is greater than one, the image will be stretched. When the scale factor is less than one, the image will be shrunk.


Note that the scale factor of a dilation must always be positive (i.e. the scale factor can never be zero or a negative number). Scale factors, however, can be equal to fractions (which we will see more of later on).

The key takeaway here is that the scale factor of a dilation is what tells you if an image is being made larger (stretched) or smaller (shrunk) and by what factor.

Now, let’s take a closer look at the dilation shown in Figure 01 above to see if we can figure out the scale factor in our first example below:


How to Find Scale Factor in 3 Easy Steps

Now that you are familiar with the key concepts and definitions associated with dilations and scale factor, you are ready to learn how to find the scale factor of a dilation using the following simple steps:

  • Step 01: Determine the coordinates of a point on the original figure and the coordinates of the coordinates of the corresponding point on the new dilated figure.

  • Step 02: Divide the x-value of the new figure coordinate by the x-value of the original figure coordinate to find the scale factor.

  • Step 03: Repeat Step 02 using the y-values to confirm your answer.

Are you ready to try out our 3-step method for finding the scale factor of a dilation? Let’s go ahead and apply these steps to solving our first problem.

Example #1: How to Find the Scale Factor

For our first example, we have to find the scale factor that was used to dilated ▵ABC onto ▵A’B’C.


Figure 04: How to Find the Scale Factor of a Dilation.


For starters, we know than the original image is ▵ABC and the new image is ▵A’B’C’. Notice that the new image is larger than the original image, so we should expect our resulting scale factor to be greater than one.

Let’s go ahead and apply our three steps to see if this is the case:

Step 01: Determine the coordinates of a point on the original figure and the coordinates of the coordinates of the corresponding point on the new dilated figure.

For the first step, we can select any point on the original image, ▵ABC. In this case, let’s select point B with coordinates (2,3). The corresponding point on ▵A’B’C’ is point B’ with coordinates at (6,9).

  • Original Image Point: B (2,3)

  • Corresponding Point on New Image: B’ (6,9)

Note that you could have chosen points A and A’ or points C and C’. As long as you are consistent, you will be able to find the scale factor.

Step 02: Divide the x-value of the new figure coordinate by the x-value of the original figure coordinate to find the scale factor.

Next, we have to take the x-value of the point from the new figure (point B’) and divide it by the x-value of the corresponding point on the original figure (point B), as follows:

  • The x-value of Point B’ at (6,9) is 6

  • The x-value of Point B at (2,3) is 2

  • 6 ➗ 2 = 3

Now we can conclude that our result is the value of our scale factor, so we can say that:

  • The scale factor is 3.


Figure 05: The scale factor is 3, which means that ▵A’B’C’ is three times as large as ▵ABC.


When we concluded that the scale factor is 3, we are saying that ▵A’B’C’ is three times as large as ▵ABC.

This should make sense by looking at the graph and by remembering that we were expecting to have a scale factor greater than one in the first place. However, to ensure that we are correct, let’s go ahead and complete the third and final step.

Step 03: Repeat Step 02 using the y-values to confirm your answer.

Finally, we have to take the y-value of the point from the new figure (point B’) and divide it by the y-value of the corresponding point on the original figure (point B), as follows:

  • The y-value of Point B’ at (6,9) is 9

  • The y-value of Point B at (2,3) is 3

  • 9 ➗ 3 = 3

We got the same answer! Now, we can conclude that:

Final Answer: The scale factor is 3.

It’s okay if you are still a little confused. Let’s go ahead and work through another example where we will find the scale factor of a dilation using our 3-steps.


Example #2: How to Find the Scale Factor

For this second example, we are again tasked with finding the scale factor of a dilation.


Figure 04: How to Find the Scale Factor of a dilation where the original image has been shrunk.


In this example, we can see that the new image of ▵S’U’V’ is the result of shrinking ▵SUV (since ▵S’U’V’ is smaller than ▵SUV). So, we know that our scale factor should be less than one.

We can now use of 3-steps to find the exact scale factor as follows:

Step 01: Determine the coordinates of a point on the original figure and the coordinates of the coordinates of the corresponding point on the new dilated figure.

Again, you can choose any point that you like as long as you are consistent. In this case, let’s choose point S on ▵SUV with coordinates at (-8,8). The corresponding point on ▵S’U’V’ is point S’ with coordinates at (-4,4).

  • Original Image Point: S (-8,8)

  • Corresponding Point on New Image: S’ (-4,4)

Step 02: Divide the x-value of the new figure coordinate by the x-value of the original figure coordinate to find the scale factor.

For the next step, let’s take the x-value of the point from the new figure (point S’) and divide it by the x-value of the corresponding point on the original figure (point S), as follows:

  • The x-value of Point S’ at (-4,4) is -4

  • The x-value of Point S at (-8,8) is -8

  • -4 ➗ -8 = 1/2

Now we can conclude that our result is the value of our scale factor, so we can say that:

  • The scale factor is 1/2.


Figure 05: How to find the scale factor that ▵SUV onto ▵S’U’V’.


A scale factor of 1/2 means that the original figure, ▵SUV, was shrunk down to half of its size to create the image of ▵S’U’V’.

Before we can confirm that our answer is correct, however, let’s complete the third and final step.

Step 03: Repeat Step 02 using the y-values to confirm your answer.

For step number three, we must take the y-value of the point from the new figure (point S’) and divide it by the y-value of the corresponding point on the original figure (point S), as follows:

  • The y-value of Point S’ at (-4,4) is 4

  • The y-value of Point S at (-8,8) is 8

  • 4 ➗ 8 = 1/2

Notice that our result, again, is 1/2, so we can say that:

Final Answer: The scale factor is 1/2.

Are you starting to get the hang of it? Let’s go ahead to work through another example.


Example #3: How to Find the Scale Factor

Let’s go ahead and use our 3-step method to solve this final example.


Figure 06: How to Find the Scale Factor of a Dilation in 3 Easy Steps.


We can use the same 3-step method that we did on the previous two examples to solve this problem.

Notice that the new image of ▵Q’R’S’ is the result of shrinking the original image of ▵QRS, so our scale factor should be less than one.

Step 01: Determine the coordinates of a point on the original figure and the coordinates of the coordinates of the corresponding point on the new dilated figure.

Just like the last two examples, you can choose any point that you like as long as you are consistent. However, for this problem, we will intentionally avoid points Q and Q’ since they both have zero as coordinate points, which could cause problems since we can’t have zero in a denominator.

Instead, let’s choose point R on ▵QRS with coordinates at (9,3). The corresponding point on ▵Q’R’S’ is point R’ with coordinates at (3,1).

  • Original Image Point: R (9,3)

  • Corresponding Point on New Image: R’ (3,1)

Step 02: Divide the x-value of the new figure coordinate by the x-value of the original figure coordinate to find the scale factor.

Moving on, we have to take the x-value of the point from the new figure (point R’) and divide it by the x-value of the corresponding point on the original figure (point R), as follows:

  • The x-value of Point R’ at (3,1) is 3

  • The x-value of Point R at (9,3) is 9

  • 9 ➗ 3 = 1/3

So, we have just figured out the ▵QRS was shrunk by a scaled factor of 1/3 to get the image of ▵Q’R’S’.

  • The scale factor is 1/3.

In other words, ▵Q’R’S’ is one-third the size of ▵QRS.


Figure 07: How to Find Scale Factor: The scale factor is 1/3.


All that we have to do now is confirm that our answer is correcting by completing the third step.

Step 03: Repeat Step 02 using the y-values to confirm your answer.

To confirm that the scale factor was 1/3 is correct, we have to take the y-value of the point from the new figure (point R’) and divide it by the y-value of the corresponding point on the original figure (point R), as follows:

  • The y-value of Point R’ at (3,1) is 1

  • The y-value of Point R at (9,3) is 3

  • 1 ➗ 3 = 1/3

Now that our answer has been confirmed, we can make the following conclusion:

Final Answer: The scale factor is 1/3.


Conclusion: How to Find Scale Factor

Understanding how to determine the scale factor of a dilation is an important geometry and algebra skill that every student must master when they are learning about transformations on the coordinate plane.

This step-by-step guide of finding scale factor reviewed the definition of a dilation on the coordinate plane and the meaning of scale factor in regards to dilations. When a scale factor, k, is greater than one, the resulting image is larger than the original image. And, when the scale factor, k, is less than one, the resulting images is smaller than the original image.

To solve problems where you are tasked with finding the scale factor of a dilation, we applied the following three step strategy:

  • Step 01: Determine the coordinates of a point on the original figure and the coordinates of the coordinates of the corresponding point on the new dilated figure.

  • Step 02: Divide the x-value of the new figure coordinate by the x-value of the original figure coordinate to find the scale factor.

  • Step 03: Repeat Step 02 using the y-values to confirm your answer.

You can use these three steps to solve any problem where you are tasked with finding the scale factor of a dilation between two figures on the coordinate plane.

Keep Learning:

How to Perform Dilations on the Coordinate Plane

Learn how to perform dilations on the coordinate plane.


Comment

What is an Isosceles Triangle? (Instant Answer)

What is an Isosceles Triangle? (Instant Answer)

What is an Isosceles Triangle?

Everything You Need to Know About Isosceles Triangles

When it comes to learning about triangles, there are a handful of different types of triangles with very specific characteristics that you will need to be familiar with—and one of the most important and most common are isosceles triangles.

In this short guide, we will tell you everything you need to know about isosceles triangles, including the isosceles triangle definition, so that you can easily an isosceles triangle and solve problems involving isosceles triangles.

So, if you need an answer to the question “what is an isosceles triangle?”, then you are in the right place! You can click here to see an instant answer or you can continue reading through this short guide for a more in-depth explanation of the features and characteristics of isosceles triangles.

You can also use the quick links below to jump to a particular section of this guide:

Let’s start with a super quick review of triangles and definitions.

What is a Triangle?

By definition, a triangle is a polygon with three sides, three corners, and three interior angles. While any three-sided polygon that satisfies this definition can be called a triangle, there are several types of triangles with specific characteristics.

Examples of different types of triangles include equilateral triangles, right triangles, and, of course, isosceles triangles.

All of the different types of triangles are shown in Figure 01 for your reference.


Figure 01: Types of Triangles


What is an Isosceles Triangle?

Isosceles Triangle Definition: An Isosceles Triangle is a triangle that has two sides of equal length.

Pretty simple, right?

By definition, an isosceles triangle is a triangle that has two sides of equal length.

Any triangle that has at least two sides of equal length can be considered an isosceles triangle.

In Figure 02 below, you can see three different examples of isosceles triangles. The notches on the sides indicate that they are equal in length to each other.


Figure 02: The isosceles triangle definition states that a triangle is isosceles when it has two equal sides.


What are the Properties of Isosceles Triangles?

Now that you know the basic definition of an isosceles triangle, let’s dive deeper into the properties of isosceles triangles and their sides and angles.

Key Properties of Isosceles Triangles

  • In addition to having two equal sides, the angles opposite of those two equal sides are also equal.

  • An altitude drawn from the base of an isosceles triangle to its vertex will always be perpendicular to that base and will dive the base into two congruent segments.

These key features are illustrated in Figure 03 below.


Figure 03: Properties of Right Triangles


Figure 03 above shows isosceles triangle △EFG. Notice that sides EF and EF are congruent (which makes this triangle isosceles by definition) and that ∠EFG and ∠EGF are also congruent.

Additionally, the altitude EH is perpendicular to the base segment FG, dividing FG into two congruent halves: segments FH and GH.

These properties apply to any isosceles triangle. If you understand these properties, you can apply them to any math problem involving an isosceles triangle!

Now that you know what is an isosceles triangle and the isosceles triangle definition, you are ready to learn about a special types of isosceles triangle—namely an isosceles right triangle (i.e. an isosceles triangle with one 90-degree angle).


What is an Isosceles Right Triangle?

An isosceles right triangle is a special type of isosceles triangle where the vertex angle is a right angle (i.e. it is equal to 90 degrees), and the two congruent angles are both equal to 45 degrees.

The isosceles right triangle is often referred to as a 45-45-90 right triangle in reference to the three angle measures being 45 degrees, 45 degrees, and 90 degrees.

These key characteristics of the isosceles right triangle are shown in Figure 04 below.


Figure 04: The properties of an isosceles right triangle.


We decided to conclude this guide by featuring the isosceles right triangle since its properties are so unique and the fact that the isosceles right triangle commonly shows up on math problems, so math students should be familiar with them.

Notice in Figure 04 above that the isosceles right triangle meets the definition of an isosceles triangle since it has two equal sides (sides AB and CB are congruent) and the angles opposite those sides are also congruent (∠BAC and ∠BCA are congruent).

However, in addition to meeting the criteria for being an isosceles triangle, an isosceles right triangle has a vertex angle that is equal to 90 degrees (i.e. it has one right angle) and the two congruent angles are both equal to 45 degrees, which is why the isosceles right triangle is often referred to as a 45-45-90 right triangle.


Conclusion: What is an Isosceles Triangle?

If you came to this guide wondering “what is an isosceles triangle?”, you now know the isosceles triangle definition as well as the key characteristics and properties of isosceles triangles.

Key Takeaway: A triangle is isosceles if it has two equal sides.

Beyond this basic isosceles triangle definition, we explored the properties and relationships between the sides and angles of isosceles triangles, namely that:

  • Every isosceles triangle has at least two equal sides.

  • The angles opposite the equal sides are also congruent to each other.

  • The altitude drawn from the base of an isosceles triangle to its vertex will always be perpendicular to that base and will dive the base into two congruent segments.

There are also a few special types of isosceles triangles, especially the isosceles right triangle (also known as the 45-45-90 triangle). The isosceles right triangle is a special case where the vertex of the triangle is a 90 degree angle and the two congruent angles are both equal to 45 degrees.

In conclusion, isosceles triangles are polygons with interesting symmetrical properties that give math students incredible opportunities to explore and learn two-dimensional figures and how they relate to real life.


More Free Resources You Will Love:

Geometric Shapes-Complete Guide

Everything you need to know about the properties and characteristics of every 2D geometric shapes.


How to Find Domain and Range of a Graph—Step-by-Step

Comment

How to Find Domain and Range of a Graph—Step-by-Step

How to Find Domain and Range of a Graph Explained

Step-by-Step Guide: How to Find Domain and Range of a Graph Function, How to Find the Domain and Range of a Graph


Step-by-Step Guide: How to find domain and range of a graph explained.


In algebra, every function can be represented as a graph on the coordinate plane. The graph of a function provides a visually representation of how the function behaves and gives you important information—including its domain and range.

This free Step-by-Step Guide on How to Find Domain and Range of a Graph Function will teach you everything you need to know about finding the domain and range of function by looking at its graph and it includes the following sections:

You can click on any of the quick links above to jump to a section, but we highly recommend that you work through each section in order to get the most out of this free guide.

Now, let’s do a quick review of some important vocabulary terms and concepts that you will need to be familiar with in order to learn how to find the domain and range of a graph.


Figure 01: Before you can learn how to find the domain and range of a graph, you have to be familiar with interval notation.


What is Interval Notation?

Before we review the meaning of domain and range and how to find domain and range of a graph, it is important that you are familiar with interval notation.

Interval Notation is used to describe a certain set of numbers using either parenthesis or square brackets.

  • Square Brackets: When an endpoint is included in a given set of numbers, we use square brackets that look like [ or ].

  • Parenthesis: When an endpoint is not included in a given set of numbers, we use parenthesis that look like ( or ).

In this section, we will use simple inequalities to teach you to understand interval notation. We will then extend this understanding to using interval notation when finding the domain and range of a graph.

Let’s consider the inequality x>4 as shown on the graph in Figure 02 below.

  • Notice that all numbers greater than 4, but not including 4, are solutions to this inequality.

  • Also notice that the arrow extends to the right forever towards infinity and that there an infinite number of values that would satisfy this inequality (i.e. there are an infinite amount of numbers that are greater than 4.


Figure 02: The inequality x>4 (x is greater than 4) on the number line.


We could express the solution to the inequality x>4 verbally as:

  • x is greater than 4 (i.e. x can be any number greater than 4, but not including 4)

And we could express the solution to the inequality x>4 using interval notation as:

  • (4,∞)

Notice that, since 4 was not included in the solution set, we used parenthesis instead of square brackets.

Now let’s consider the inequality x≥4 as shown on the graph in Figure 03 below.


Figure 03: The inequality x≥4 (x is greater than or equal to 4) on the number line.


Notice that all numbers greater than 4, and including 4, are solutions to this inequality.

We could express the solution to the inequality x≥4 verbally as:

  • x is greater than or equal to 4 (i.e. x can be 4 or any number greater than 4)

And we could express the solution to the inequality x>4 using interval notation as:

  • [4,∞)

Notice that, since 4 was included in the solution set, we used square brackets instead of parenthesis.

The difference between the solutions to x>4 and x≥4 in interval notation are summarized in Figure 04 below. The key takeaway here is that you use parentheses when the endpoint is a number and is not included in the solution set and square brackets when the endpoint is a number and is included in the solution set.


Figure 04: Use parentheses when the endpoint is a number and is not included in the solution set and square brackets when the endpoint is a number and is included in the solution set.


Did you notice that you only have to differentiate between parentheses and brackets when the endpoint is a number?

In the case of infinity, you will always use parentheses since ∞ is not a definitive value or a true endpoint.

Next, let’s take a look at one more inequality: x ≤ 0 as shown on the graph in Figure 05 below:


Figure 05: The inequality x0 (x is less than or equal to 0) on the number line.


Notice that all numbers less than 0, and including 0, are solutions to this inequality.

We could express the solution to the inequality x0 verbally as:

  • x is less than or equal to 0 (i.e. x can be 0 or any number less than 0)

And we could express the solution to the inequality x0 using interval notation as:

  • (-∞,0]

When using interval notation, we have to identify the smallest value(s) on the left side and the largest on the right side. So, in this case of x0, we have to state on the left side that the smallest values are approaching negative ∞ and, on the right, the largest possible value is 0 (and, since 0 is included the solution set, we have to use a square bracket).

Figure 06 below illustrates a few more examples of the solutions of inequalities expressed in interval notation. Make sure that you are comfortable with interval notation before moving forward, as it is key to learning how to find domain and range of a graph function.


Figure 06: How to find domain and range of a graph starts with understanding interval notation.


What is Domain and Range?

Domain

In algebra, the domain of a function refers to the set of all possible x-values for that function.

For example, the function y=x² has a domain of (-∞,∞). This means that the domain includes all real numbers since any number can be squared (positive, negative, or zero) without any limitations.

Range

In algebra, the range of a function refers to the set of all possible y-values for that function.

For example, the function y=x² has a range of [0,∞) because any number squared, whether positive or negative, will always be greater than or equal to zero (the result can never be negative).


Figure 07: The domain of a function refers to the set of all possible x-values and the range refers to all possible y-values.


Now that you are familiar with interval notation and the meaning of domain and range, let’s go ahead and look at our first example.

For example #1, we will look at the graph of the function y=x². As previously stated, we already know the domain and range of y=x² are:

  • The domain of y=x² is (-∞,∞)

  • The range of y=x² is [0,∞)

Let’s see how we can verify that we are correct simply by looking at the graph of y=x².


How to Find Domain and Range of a Graph

Example #1: Find the Domain and Range of a Graph

For our first example, we are given the graph of the function f(x)=x^2 and we are tasked with finding the domain and the range (note that our answers must be in interval notation).


Figure 08: Find the domain and range of the graph of y=x^2.


Remember that the domain refers to all of the possible x-values, and the range refers to all of the possible y-values.

Let’s start with finding the domain of this graph. Notice that the graph is a parabola that extends forever on both the left and right-side of zero. This means that, as far as the x-axis is concerned, that the graph will extend forever to the left towards negative infinity and towards the right forever towards positive infinity.

What does mean? The graph will eventually cross through every possible value of x without any exceptions or limitations.

So, we can conclude that the domain of this function is (-∞,∞), as shown in Figure 09 below:


Figure 09: The domain of the graph is (-∞,∞), meaning that the graph will pass through every possible x-value.


Next, let’s find the range. Remember that the range refers to all of the possible y-values that the graph passes through.

Unlike the domain, the graph clearly will not pass through every possible y-value. The lowest y-value of this particular graph is the vertex, or turning point, of the parabola, which is at the origin.

So, the smallest possible y-value for this graph is 0 and the largest is infinity since it continues forever and ever in an upwards direction.

So, we can conclude that the range of this function is [0,∞), as shown in Figure 10 below:


Figure 10: The range of the graph is [0,∞), meaning that the graph will pass through every possible y-value that is greater than or equal to 0.


Now, we have confirmed that the function y=x^2 has a domain and range of:

  • Domain: (-∞,∞)

  • Range: [0,∞)

Now let’s move onto another example where we gain more experience with how to find domain and range of a graph.


Example #2: Find the Domain and Range of a Graph

For our next example, we have to find the domain and range of the graph of the function f(x)=-|x|.


Figure 11: How to Find the Domain and Range of a Graph Example #2


The domain of the graph refers to all of the possible x-values.

Just like the previous example, the graph will pass cross through every possible x-value without any exceptions or limitations, so we can conclude that:

  • Domain: (-∞,∞)

The range of the graph refers to all of the possible y-values.

Notice that this graph is similar to the graph in Example #1, except it is upside down. As far as the range is concerned, this graph has an upper limit at 0 and a lower limit at negative infinity since it extends forever and ever in a downward direction, so we can conclude that:

  • Range: (-∞,0]


Figure 12: The graph has a domain of (-∞,∞) and a range of (-∞,0].


In conclusion, the graph y=-|x| has the following domain and range:

  • Domain: (-∞,∞)

  • Range: [0,∞)

Are you starting to get the hang of it? Let’s continue onto the next example.


Example #3: Find the Domain and Range of a Graph

For our third example, let’s find the domain and range of the graph of f(x)=(1/4)x^3


Figure 13: How to Find Domain and Range of a Graph


Since this graph extends forever and ever in both directions left and right, we know that the domain of the graph will be all real numbers and we can conclude that:

  • Domain: (-∞,∞)

Similarly, the graph also extends forever and ever in both directions up and down, so we know that the range of the graph will also be all real numbers and we can conclude that:

  • Range: (-∞,∞)


Figure 14: Both the domain and range of the graph are (-∞,∞).


Final Answer: The domain and range of a graph with equation f(x)=(1/4)x^3 is:

  • Domain: (-∞,∞)

  • Range: [0,∞)


Example #4: Find the Domain and Range of a Graph

Moving on, we have to find the domain and range of the graph of f(x)=√(x+6)


Figure 15: How to find the domain range of a graph of f(x)=√(x+6)


The graph in our fourth example involves a function with a square root. Notice that, unlike the first three examples, the domain has some limitations.

Namely, the domain starts at -6 and extends forever to the right. So, in this case, the domain is not all real numbers. Rather, the domain is:

  • Domain: [-6,∞)

And, the range also has limitations and is not all real numbers. Notice that the y-values start at zero and extend forever in an upward direction, so we can conclude that the range is:

  • Range: [0,∞)


Figure 16: How to find the domain and range of a function graph explained.


Final Answer: The graph of the function f(x)=√(x+6) has a domain and range of:

  • Domain: [-6,∞)

  • Range: [0,∞)


Conclusion: How to Find Domain and Range of a Graph

Being able to identify the domain and range of a graph function and expressing the domain and range using interval notation are important and useful algebra skills.

In this free guide, we learned the definitions of the domain and range of a function, how to describe the domain and range of a function using interval notation, and how to find the domain and range of a graph of a function.

Key takeaways:

  • Domain and range are expressed using interval notation. When an endpoint is included in, we use square brackets and, when it is not, we use parentheses. Whenever -∞ or ∞ is an endpoint, we use parentheses.

  • Domain and range, when expressed using interval notation, always puts the smallest value/endpoint on the left and the largest value/endpoint on the right.

  • The domain of a function refers to the set of all possible x-values for that function and the range of a function refers to all of the possible y-values for that function.

  • When determining the domain of a function by looking at its graph, you need to look at its horizontal behavior (how it travels across the x-axis in both positive and negative directions).

  • When determining the range of a function by looking at its graph, you need to look at its vertical behavior (how it travels across the y-axis in both positive and negative directions).

That’s all there is to it! If you still confused about how to find the domain and range of a graph, we highly recommend going back and working through the practice problems again.

Keep Learning:

How to Find the Vertex of a Parabola in 3 Easy Steps

Learn how to find the coordinates of the vertex point of any parabola with this free step-by-step guide.


Comment

The Ultimate Guide to Passing the Texas STAAR Test

2 Comments

The Ultimate Guide to Passing the Texas STAAR Test

STARRTEST.jpg

How to Pass the Texas STAAR Test

This ultimate guide to passing your STAAR Test will help you understand how the exam works, how the questions are structured, and how to study so that you can not only pass the STAAR Test but earn an advanced score.

What is a STAAR Test?

The State of Texas Assessments of Academic Readiness (STAAR) Standardized Tests are given to students in Texas public elementary, middle, and high schools as a means of measuring student knowledge at each grade level.

What Grades are STAAR Tested?

The STAAR Tests knowledge and skills in reading, writing, math, social studies, and science. They are taken by all public school students in the state of Texas in grades 3 through12.

Is STAAR Test Mandatory?

STAAR Tests are mandatory for all public school students in Texas. Any private or charter school that does not receive funding from the state of Texas is not required to have students take STAAR exams.

How Long Are STAAR Tests?

Al students have four full hours to finish a STAAR test. The only exception to this rule is any end-of-course English exam, where students are given five hours.

Students are not permitted to leave if they finish early and are expected to sit quietly until the entire testing session has concluded.

What Happens If You Fail the STAAR Test?

The only students who are required to retake the STAAR Tests are 5th and 8th grade students who do not pass math and/or reading.

There are two opportunities provided to take the test during the school year, and if they don't pass the 2nd time, there is a meeting to determine if the student should attend summer school interventions, then retake it for the 3rd time or not. Often times the students are placed into the next grade level based on other assessment data gathered throughout the year. 8th graders who are in Algebra do not take the 8th grade Math STAAR. They will take the Algebra EOC to receive the high school credit for that course.

Image Source: wikipedia.org

Image Source: wikipedia.org

STAAR Tests Taken by High School Students

  • Algebra 1

  • United States History

  • English I

  • English II

  • Biology

Image Source: HoustonISD.org

Image Source: HoustonISD.org

STAAR Released Test for All Grade Levels

The best way to prepare for and eventually pass your STAAR Test is to get plenty of practice and familiarity with the format of the exams and the kind of questions you will see.

Use the links below to access released STAAR Test questions and answer keys.

3rd Grade Released STAAR Test and Answers: Math | Reading

4th Grade Released STAAR Test and Answers: Math | Reading | Writing

5th Grade Released STAAR Test and Answers: Math | Reading | Science

6th Grade Released STAAR Test and Answers: Math | Reading

7th Grade Released STAAR Test and Answers: Math | Reading | Writing

8th Grade Released STAAR Test and Answers: Math | Reading | Science | Social Studies

High School Released STAAR Test and Answers: Algebra 1 | English I | English II | Biology | U.S. History

Sample question from the 2018 Algebra I released STAAR Test. Source: tea.texas.gov

Sample question from the 2018 Algebra I released STAAR Test. Source: tea.texas.gov

STAAR Practice Test

Are you looking for more opportunities to practice for your STAAR Test? The links below share more opportunities to take a STAAR Practice Test for any subject:

3 Tips for Passing the Your STAAR Test

1.) view Released STAAR Tests and Released Tests

Many STAAR Tests (with corresponding answer keys) from the past several years are available for free online. Practice at home to gauge your readiness and identify areas of weakness that you can focus on while studying.

8th Grade Math STAAR Reference Sheet

8th Grade Math STAAR Reference Sheet

2.) Know Your Reference Sheets for Math

Familiarize yourself with the math reference guide prior to taking the STAAR Test and know what formulas are included (and what formulas are not).

The reference sheet is valuable because it saves you from having to memorize many important math formulas, which will save your time and energy while studying.

Pro Tip: If there is anything that you have memorized for the exam, write it down on your reference sheet as soon as the test begins. By transferring the information to paper, you are freeing up valuable mental energy that you can put towards the exam questions.

3.) Break Up Your Studying

Cramming for a big test may do more harm than good. To learn more about the negative consequences of cramming, check out Why Cramming for Tests Often Fails by BBC.

Rather than cramming, try spacing out your study sessions over many weeks leading up to your STAAR test.


Have any questions or ideas? Share your thoughts in the comments section below!

(Never miss a Mashup Math blog--click here to get our weekly newsletter!)

By Anthony Persico

static1.squarespace-1-1.png

Anthony is the content crafter and head educator for YouTube's MashUp Math . You can often find me happily developing animated math lessons to share on my YouTube channel . Or spending way too much time at the gym or playing on my phone.


STAAR_Pin.jpg
 

2 Comments