Box and Whisker Plot Definition

Source: Mashup Math MJ
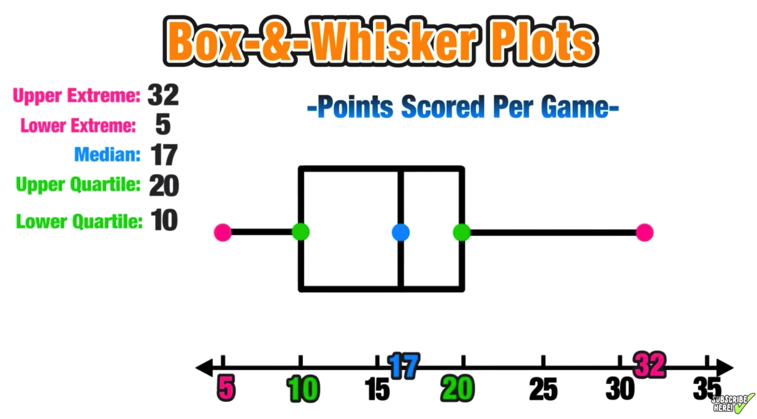
A box and whisker plot is a visual tool that is used to graphically display the median, lower and upper quartiles, and lower and upper extremes of a set of data.
Box and whisker plots help you to see the variance of data and can be a very helpful tool.
This guide to creating and understanding box and whisker plots will provide a step-by-step tutorial along with a free box and whisker plot worksheet.
Let’s get started by looking at some basketball data!
How to Make a Box and Whisker Plot

Observe the following data set below that shares a basketball players points scored per game over a seven-game span:

Step One: The first step to creating a box and whisker plot is to arrange the values in the data set from least to greatest.
In this example, arrange the points scored per game from least to greatest.

Step Two: Identify the upper and lower extremes (the highest and lowest values in the data set).
The lower extreme is the smallest value, which is 5 in this example.
The upper extreme is the highest value, which is 32 in this example.

Step Three: Identify the median, or middle, of the data set.
In this example, the median is 17.
See Also: Check Out This Awesome Mean, Median, and Mode Activity

Step Four: Identify the upper and lower quartiles.
To find the lower quartile and the upper quartile, start by splitting the data set at the median into lower and upper regions.

The upper quartile is the median of the upper region, and the lower quartile is the median of the lower region.
In this example, the upper quartile is 20 and the lower quartile is 10.

Now we have all of the information that we will need to construct our box and whisker plot!

Step Five: Construct the Box and Whisker Plot
To construct a box and whisker plot, start by drawing a number line that fits the data set.

Start by plotting points over the number line at the lower and upper extremes, the median, and the lower and upper quartiles.

Next, construct two vertical lines through the upper and lower quartiles, and then constructing a rectangular box that encloses the median value point.

Then construct a vertical line through the median point that extends to the top and bottom of the rectangle.
This is the box in the box and whisker plot.

Finally, draw horizontal lines that connect the lower quartile to the lower extreme and the upper quartile to the upper extreme to complete the box and whisker plot.
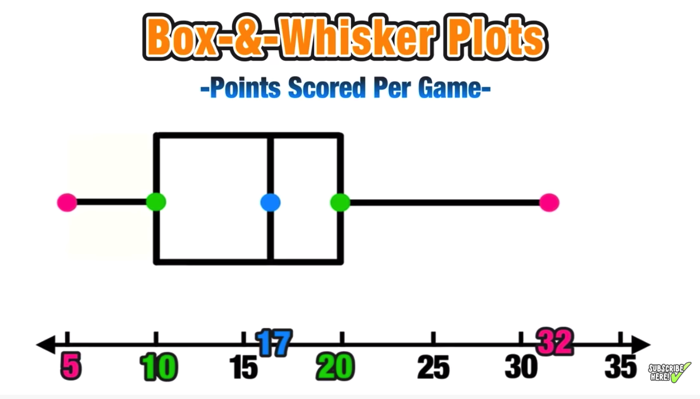
The box and whisker plot is complete!
Box and Whisker Plot Worksheet
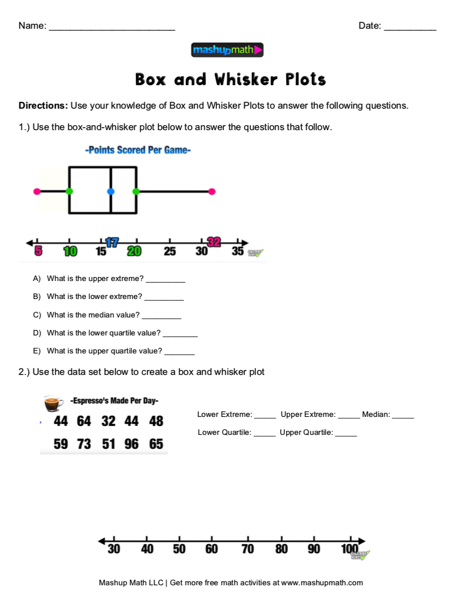
Are you looking to get some more practice with making and analyzing box and whisker plots?
Check out the following free box and whisker plot worksheet, which is available as a PDF download!
Click here to download your free Box and Whisker Plot worksheet.
Answer key included.
Box and Whisker Plot Video Lesson
Check out our free Box and Whisker Plots Explained video lesson on YouTube for a more in-depth look:
Tags: box and whisker plot explained, box and whisker plot definition, box and whisker plot problems, box and whisker plot outliers, box and whisker plot worksheet, box and whisker plot range
Have thoughts? Share your thoughts in the comments section below!

(Never miss a Mashup Math blog--click here to get our weekly newsletter!)
By Anthony Persico
Anthony is the content crafter and head educator for YouTube's MashUp Math. You can often find me happily developing animated math lessons to share on my YouTube channel . Or spending way too much time at the gym or playing on my phone.
Related Posts: