Graphing Inequalities on a Number Line
Math Skills: How to Graph Inequalities on a Number Line

Free Step-by-Step Guide: Graphing Inequalities on a Number Line
Graphing inequalities on a number line is an important math skill that helps students to visualize all of the possible solutions to any given inequality equation. Whether you are a middle school student learning about inequalities for the first time, or if you simply need a review of how to graph inequalities on a number line, this student guide will teach you everything you need to know about graphing inequalities on a number line.
In this free step-by-step tutorial on Graphing Inequalities on a Number Line, you will learn how to accurately graph an inequality on a number line using a simple three-step method. Once you learn our three-step method for graphing inequalities and work through a few example problems, you will be able to solve any math problem that requires you to graph an inequality on a number line.
This tutorial is organized by the following subtopics (you can follow each section in order or you can use the quick-links below to jump to a subtopic of interest):
Now we are ready to get started with a quick recap of inequalities and what they represent.

Lesson Preview: How to Graph Inequalities on a Number Line.
Quick Recap: Inequalities
Before we work through some examples of graphing inequalities on a number line, it is important that you understand some key vocabulary and concepts related to inequalities and inequality equations.
What is an inequality?
Definition: In math, an inequality is a relationship where two values or expressions that are not equal to each other are being compared. Since the two values or expressions are not equal, rather than using an equals sign (=), we use an inequality sign.
There are four types of inequalities, each with its own sign:
Greater Than: >
Less Than: <
Greater Than or Equal To: ≥
Less Than or Equal To: ≤
These four types of inequality signs are illustrated in Figure 01 below.

Figure 01: The four types of inequality symbols.
What is an inequality equation?
An inequality equation is an equation that uses an inequality symbol instead of an equals sign.
While an equation with an equals sign has only one possible solution, an inequality equation has infinite possible solutions.
For example, let’s consider the linear equation x=5. The only value of x that would make this equation true is 5 (since 5 is the only number that equals 5).
However, what if we changed the equals to sign (=) to an inequality? For example, consider the inequality x≥5. This inequality means that “x is greater than or equal to 5”. In other words, any value that is equal to 5 or greater would be a solution to this inequality (e.g. 6, 29, 88.3, and 997 would all be solutions).
Again, equations have one possible solution, while inequalities have an infinite amount of possible solutions:
Linear Equation: x=5 → 5 is the only solution
Inequality: x≥5 → Any value that is 5 or larger can be a solution
Figure 02 below illustrates the difference between the solution of an equation and the solution of an inequality.

Figure 02: What is the difference between the solution of a linear equation and the solution of an inequality?
Now that you know the difference between the solution of an equation (one possible solution) and the solution of an inequality (infinite amount of solutions), it can be super helpful to graph the solution of an inequality on a number line so that you may visual the set of numbers that holds all of possible solutions of an inequality.
Let’s take a closer look at the graph of the inequality x≥5 on a number line.
This inequality has a solution where x can be any number that is 5 or larger. Here are some examples of solutions and non-solutions:
Solutions: 5, 6, 9, 25, 309
Non-Solutions: 4, 3, 0, -51
The graph of x≥5 on a number line, as shown in Figure 03 below makes it very easy for us to visualize whether or not a given number is a solution or a non-solution.

Figure 03: How to Graph Inequalities on a Number Line: x≥5
Looking at the graph above, we can see that there is a shaded circle over 5 and an arrow starting from that circle and moving along the number line towards the right.
Every number beneath this arrow will be a solution to the inequality. Every number that is not underneath the arrow will be a non-solution.
Now that you understand how to read the graph of an inequality on a number line and why such a graph is so useful, you are ready to learn how to graph inequalities on a number line on your own!
How to Graph Solutions to Inequalities on a Number Line
Here are three easy steps that you can follow in reference to graphing inequalities on a number line:
Step One: Determine whether the circle will be open or closed and plot it on the number line.
Step Two: Make sure that the variable is on the left side of the inequality and determine the direction of the arrow.
Step Three: Draw your arrow and complete the graph.
Before we dive into the practice problems, let’s take a closer look at each step.
We will do this by applying the three steps to the inequalities x>7 and x≤6
Step One: Determine whether the circle will be open or closed and plot it on the number line.
For our first step, we have to determine whether or not the circle on our number line over the number 9 will be open or closed.
To make this determination, we have to look at the inequality sign:
Open Circle: > or < (means that the number is not included in the solution set)
Closed Circle: ≥ or ≤ (means that the number is included in the solution set)
So, we know that:
x > 7 will have an open circle on the number line over the number 7
x ≤ 6 will have a closed circle on the number line over the number 6

Figure 04: Inequalities with a > or < sign will have an open circle and inequalities with a ≥ or ≤ sign will have a closed circle.
What is the key difference between an open circle (> or <) and a closed circle (≥ or ≤)?
In cases like x>7 (x is greater than 7), the open circle means that 7 is not a possible solution. This should make sense because 7 is not greater than 7.
In cases like x≤6 (x is less than or equal to 6), the closed circle means that 6 is a possible solution. This should make sense because 6 is less than or equal to 6.
Step Two: Make sure that the variable is on the left side of the inequality and determine the direction of the arrow.
For both of our inequalities, x>7 and x≤6, the variable, x, is already on the left side. So, we just have to determine the direction of the arrow:
> or ≥ : arrow travels to the right: →
< or ≤: arrow travels to the left: ←
A helpful way to remember how to determine the direction of your arrow is to think of the inequality sign as the head of the arrow. As long as the variable is on the left-side, you can let the direction of the inequality sign dictate the direction of the arrow.
For x>7, the arrow will travel to the right (→), and, for x≤6, the arrow will travel to the left (←).

Figure 05: > or ≥ arrow travels to the right: →; < or ≤: arrow travels to the left: ←
So, we know that:
x > 7 will have an arrow traveling to the right
x ≤ 6 will have an arrow traveling to the left
Step Three: Draw your arrow and complete the graph.
For our final step, we simply have to draw our arrow facing in the correct direction and complete our graph.
After completing Step One and Step Two, we determined that:
x > 7 has an open circle over 7 with an arrow traveling to the right
x ≤ 6 has a closed circle over 6 with an arrow traveling to the left
So, we can complete the graphs of x > 7 and x ≤ 6 as shown in Figure 06 below:

Figure 06: The completed graphs of the inequalities x>7 and x≤ 6 on a number line.
You have just successfully learned how to graph solutions to inequalities on a number line.
Now that you know the three steps to solving the question, how do I graph an inequality on a number line?, you are ready to take on a few more practice problems.
How to Graph Inequalities on a Number Line
Graphing Inequalities on a Number Line Example 1
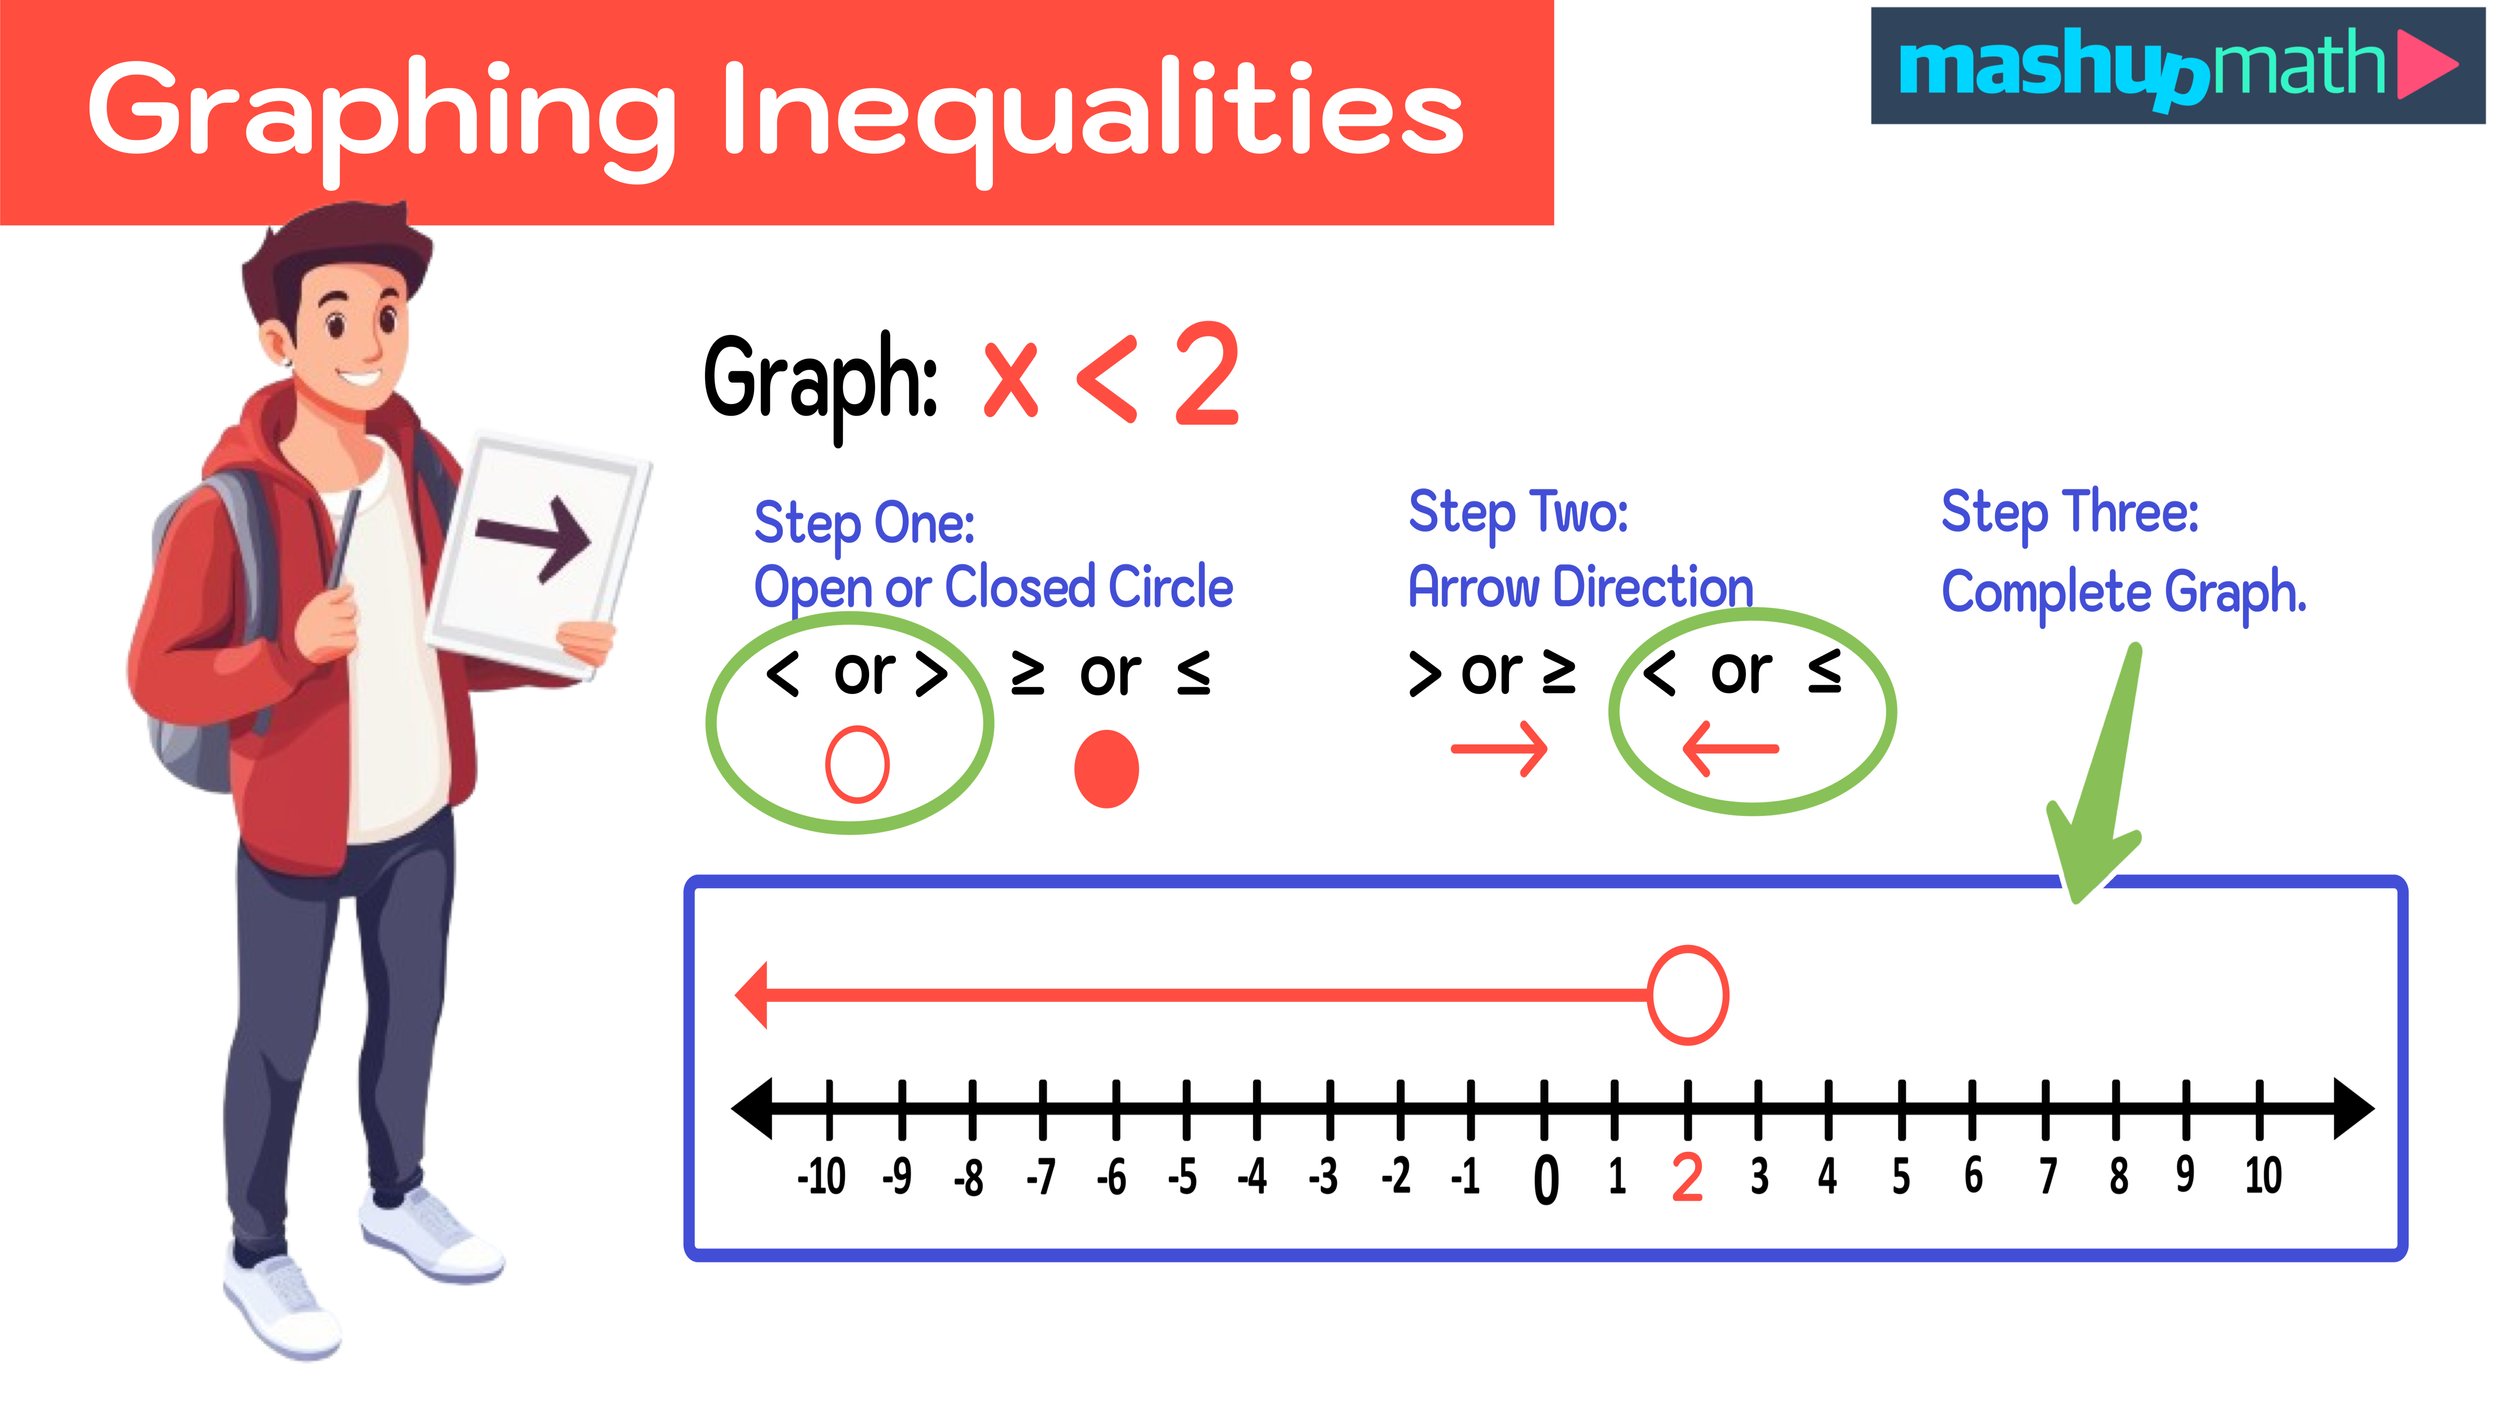
Example: Graph the following on a number line: x < 2
For this first example, and all of the examples in this guide, we will use our three-step process to successfully graph the inequality on a number line.
Step One: Determine whether the circle will be open or closed and plot it on the number line (< or > will be open; ≥ or ≤ will be closed).
Let’s start by determining whether our circle will be open or closed. Since the inequality in this example is <, our circle will be open.
The graph of the inequality x<2 will have an open circle.
Now we are ready for the next step.
Step Two: Make sure that the variable is on the left side of the inequality and determine the direction of the arrow (> or ≥ : arrow travels to the right: →; < or ≤: arrow travels to the left: ←)
Next, we have to determine the direction of the arrow. Since the variable is already on the left side of the inequality sign, we know that the inequality x<2 will travel to the left (←).
The graph of the inequality x<2 will have an arrow that travels to the left (←).
Let’s now move onto the third and final step.
Step Three: Draw your arrow and complete the graph.
Finally, we can draw our graph now that we have already determined that:
x < 2 has an open circle over 2 with an arrow traveling to the left
Our completed graph for Example #1 is illustrated in Figure 07 below.

Figure 07: Graphing Inequalities on a Number Line: Example #1 Solved
Now, let’s move onto our next example of how to graph inequalities on a number line.
How to Graph Solutions to Inequalities on a Number Line Example 2
Example: Graph the following on a number line: x ≥ 0
For this second example, we can again use of three-step process to graph the inequality on a number line.
Step One: Determine whether the circle will be open or closed and plot it on the number line (< or > will be open; ≥ or ≤ will be closed).
In this example, the inequality sign is ≥ (greater than or equal to), so our circle will be closed.
The graph of the inequality x ≥ 0 will have a closed circle.
Step Two: Make sure that the variable is on the left side of the inequality and determine the direction of the arrow (> or ≥ : arrow travels to the right: →; < or ≤: arrow travels to the left: ←)
Now we have to figure out which direction our arrow will travel from our closed circle. In this example, the variable is already on the left side of the inequality sign, so we can determine that the arrow for the graph of the inequality x ≥ 0 will travel to the right (→).
The graph of the inequality x ≥ 0 will have an arrow that travels to the right (→).
Step Three: Draw your arrow and complete the graph.
Now we have all of the information that we need to graph the inequality on a number line:
x ≥ 0 has a closed circle over 0 with an arrow traveling to the right
Figure 08 below illustrates what the completed graph of x ≥ 0 on a number line will look like.

Figure 08: How to graph inequalities on a number line: x ≥ 0 has a closed circle over zero on the number line with an arrow traveling from the center of the circle and to the right.
Graphing Inequalities on a Number Line Example 3
Example: Graph the following on a number line: -3 < x
We can again use our three-step method to solve our final example, where we have to graph the inequality -3 < x on a number line.
Step One: Determine whether the circle will be open or closed and plot it on the number line (< or > will be open; ≥ or ≤ will be closed).
For the inequality in Example #3, our inequality sign is <, which means that our graph will include an open circle.
The graph of the inequality -3 < x will have an open circle.
Now, let’s move onto the second step.
Step Two: Make sure that the variable is on the left side of the inequality and determine the direction of the arrow (> or ≥ : arrow travels to the right: →; < or ≤: arrow travels to the left: ←)
Unlike the first two examples, the inequality in Example #3 has the variable on the right side of the inequality sign: -3 < x
In order to determine the direction of our arrow, we have to “reverse” the order of the inequality equation as follows:
-3 < x → x > -3
Notice that, in addition to swapping the position of -3 and x, we also reversed the direction of the inequality sign:
< became >
*Whenever you “reverse” the order of an inequality equation to get the variable on the left side like we did in this example, you also have to reverse the direction of the inequality sign.
Now we are left with x > -3, so our variable is on the left side and we can conclude that the arrow for the graph of the inequality on a number line to the right (→).
The graph of the inequality x > -3 will have an arrow that travels to the right (→).
Step Three: Draw your arrow and complete the graph.
Finally, we can complete Example #3 by graphing the inequality on a number line using the following information that was collected from Steps One and Two:
x > -3 has an open circle over -3 with an arrow traveling to the right
The completed graph of the inequality x > -3 on a number line is shown in Figure 09 below.

Figure 09: Graphing Inequalities on a Number Line: x>-3
Conclusion: Graphing Inequalities on a Number Line
Unlike linear equations, which have only one possible solution, inequalities have an infinite amount of possible solutions. Graphing inequalities on a number line is a useful way to visualize the infinite amount of values in the solution sets of an inequality.
You can learn how to graph inequalities on a number line by following these three steps:
Step One: Determine whether the circle will be open or closed and plot it on the number line (< or > will be open; ≥ or ≤ will be closed).
Step Two: Make sure that the variable is on the left side of the inequality and determine the direction of the arrow (> or ≥ : arrow travels to the right: →; < or ≤: arrow travels to the left: ←)
Step Three: Draw your arrow and complete the graph.
As long as you can follow these three steps, you can successfully graph inequalities on a number line.
Keep Learning:

Free Blank Number Lines for All Grade Levels
Download free PDF number lines for all grade levels and topics.


