Parent Functions and Parent Graphs Explained!

4 Comments

Parent Functions and Parent Graphs Explained!

What are Parent Functions and Parent Function Graphs?

Learning about parent functions and parent graphs will give you better insight into the behaviors of a myriad of other functions that you will often come across in algebra and beyond. Your conceptual understanding of parent functions and their graphs is the key to working out transformations of equations and graphs.

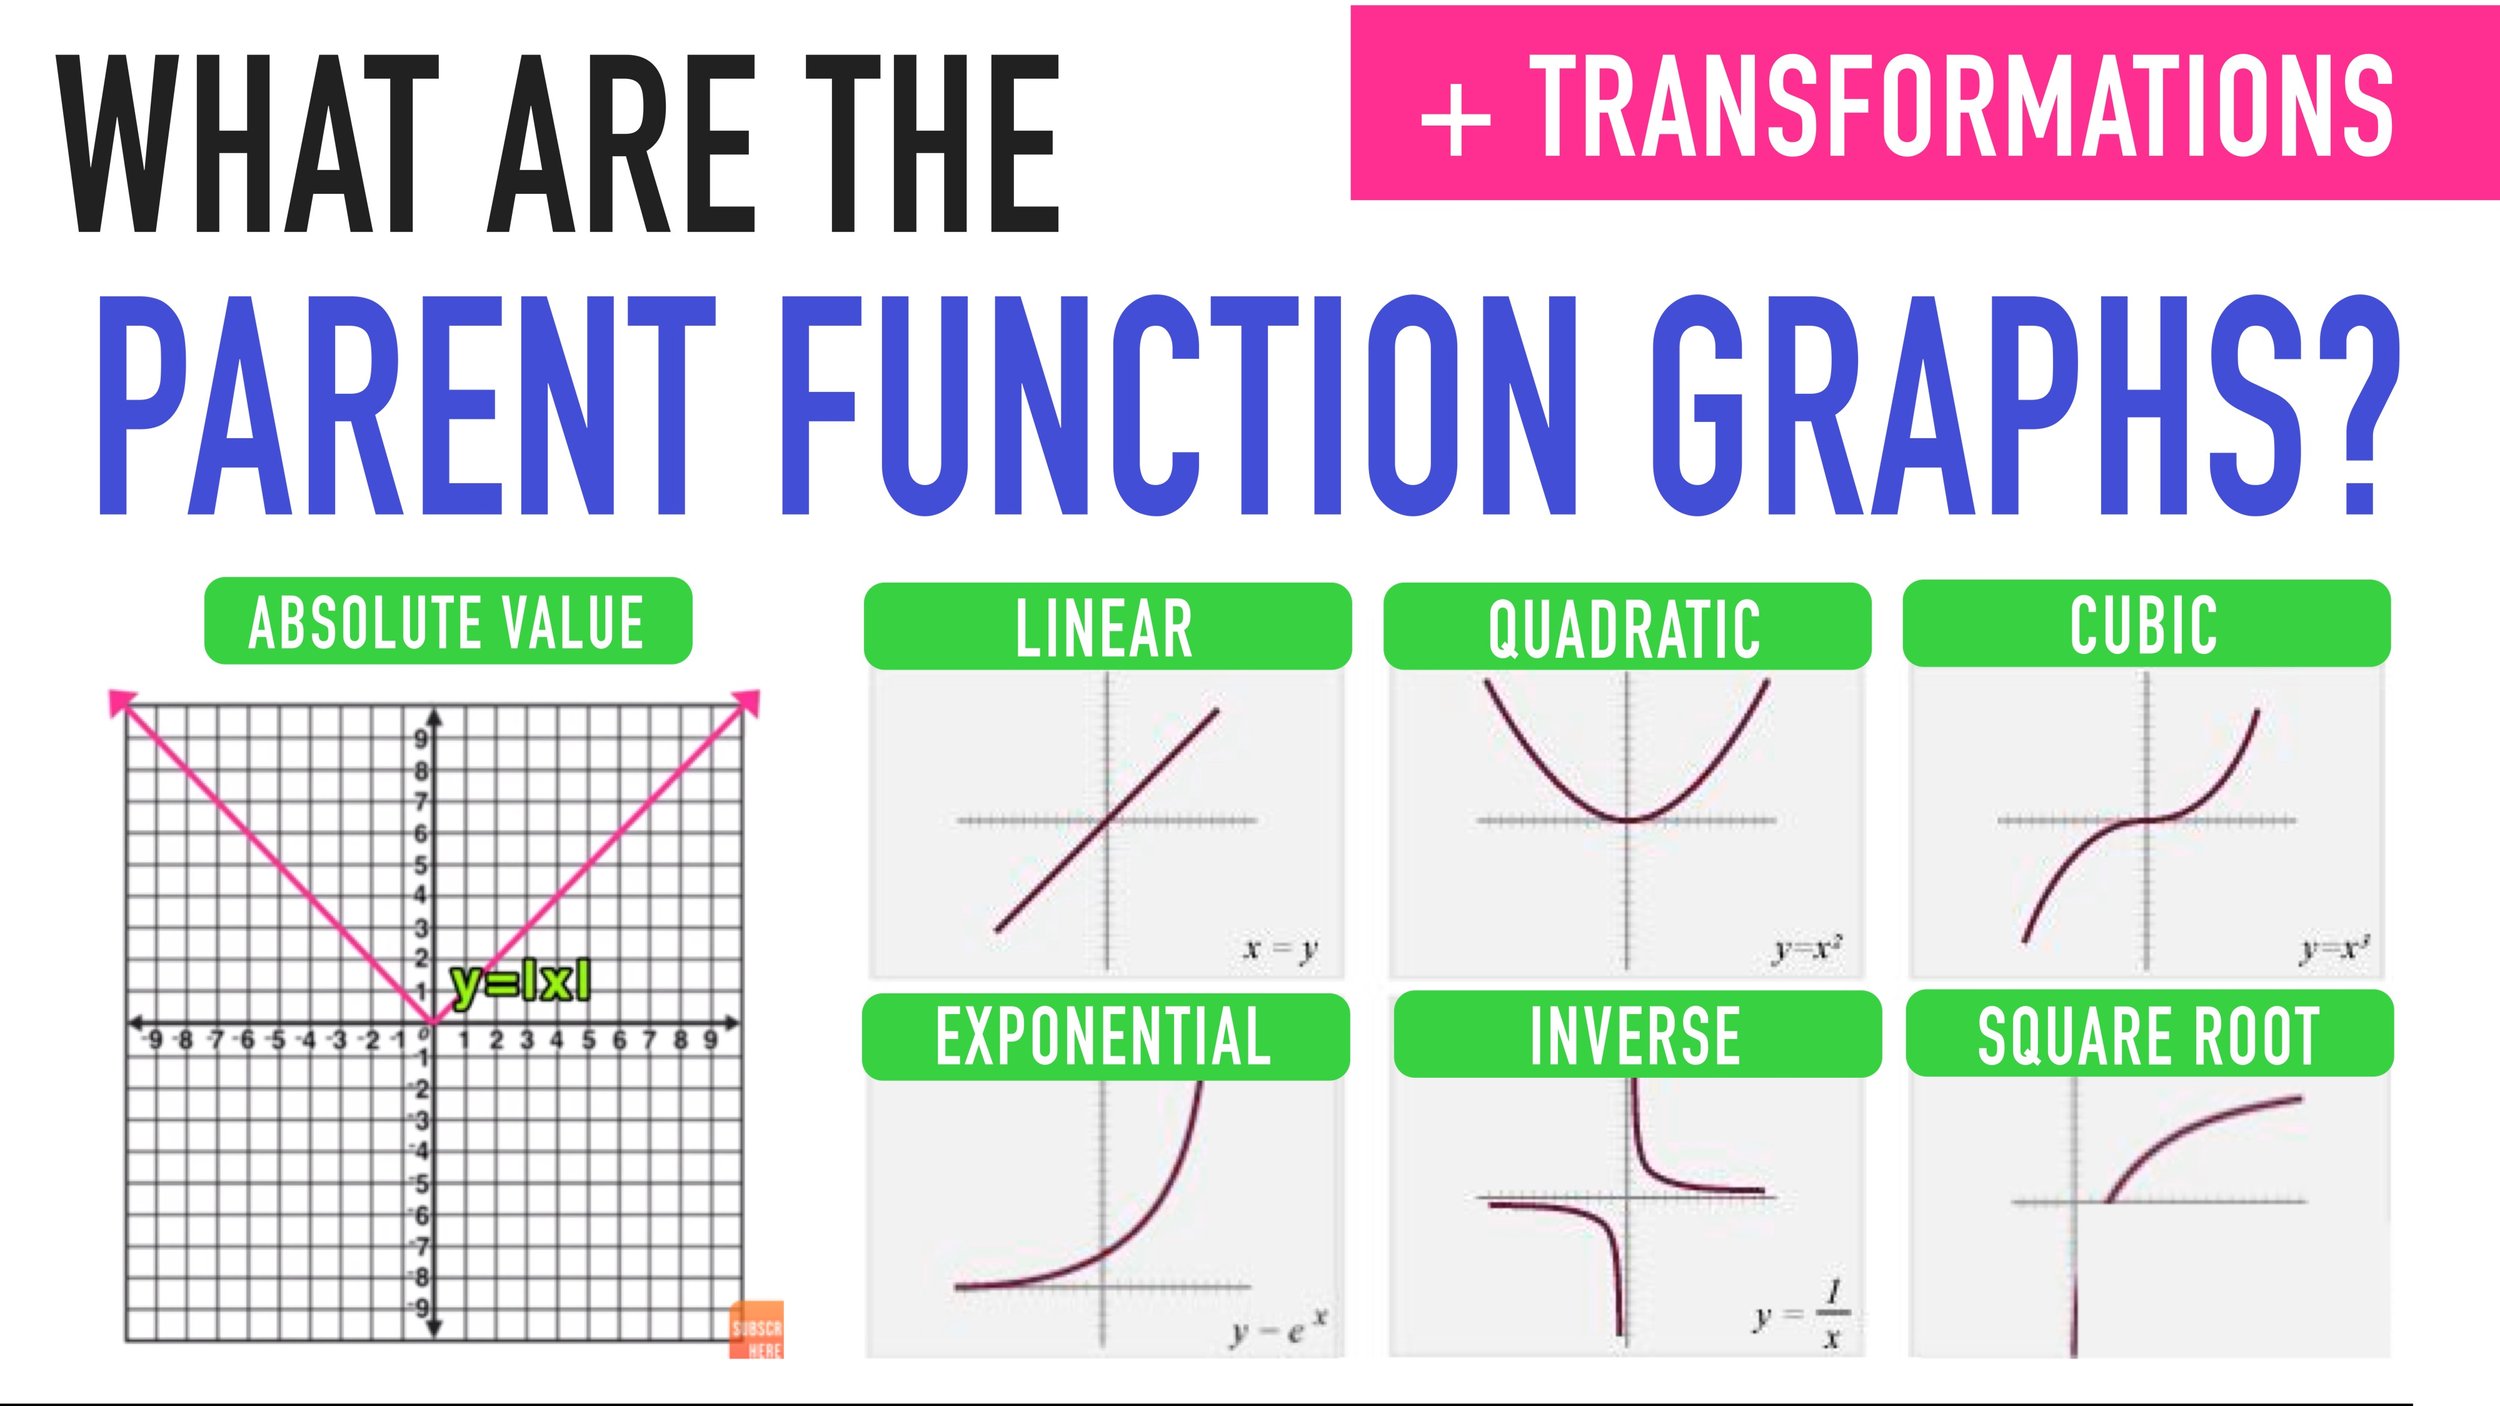
The following free guide to Parent Functions and Their Graphs will explain what parent functions are, what their graphs look like, and why understanding their behavior is so important in math. In this post, we will explore the parent functions of the following commonly occurring functions:

  • Absolute Value Parent Function

  • Linear Parent Function

  • Quadratic Parent Function

  • Cubic Parent Function

  • Exponential Parent Function

  • Inverse Parent Function

  • Square Root Parent Function

By the end of this guide, you will be able to identify the parent function of a function, use it to sketch graphs, and determine the function associated with a graph with ease!

Before you learn about parent functions and parent function graphs, let’s do a quick recap of some key vocabulary terms and definitions related to parent functions.

What is a parent function? What is a parent graph?

In math, a parent function is a function from a family of functions that is in its simplest form—meaning that it has not been transformed at all.

A parent graph is the graph of a parent function on the coordinate plane.

While these definitions may sound confusing at first glance, the concepts are actually pretty simple when you look at them visually.

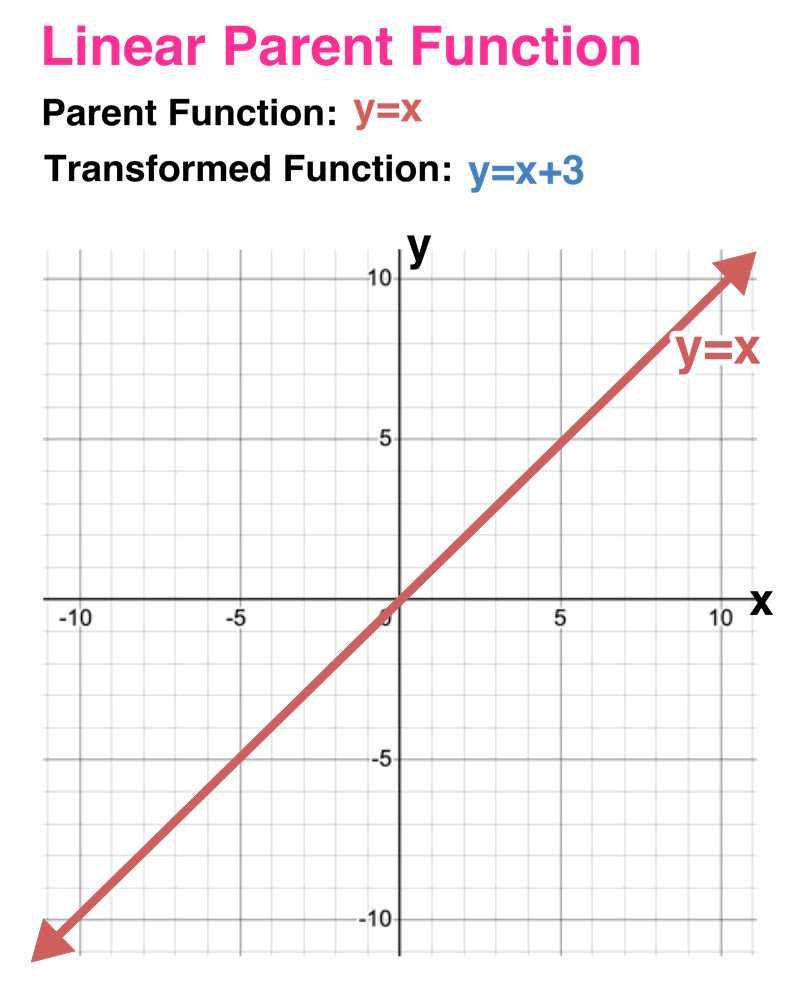
For example, let’s consider the liner functions y=x and y=x+3.

In this case, the family of functions is the linear function (any function of the form y=mx+b) that represents a line of the coordinate plane.

So, in this case, y=x is the linear parent function, and y=x+3 is just a transformed version of the parent function (because it was shifted up three units from the original parent function’s position on the graph).

Again, notice that the function y=x is the linear parent function (the line y=x on the coordinate-plane is the parent graph) and that the function y=x+3 is a transformed version of the parent function (it was shifted 3 units upward).

All Parent Functions…

If you understand the linear parent function and what it represents, then you can understand all parent functions.

The animated GIF to the right further demonstrates what a linear parent function is and how it relates to all other linear functions.

The key takeaway right now is that every function family (linear, quadratic, cubic, square root, etc.) has a parent function which all other functions in that family can be derived from simply by transforming the basic parent function.

Parent Functions and Parent Graphs

What is a parent function and what are the parent function graphs?

Definition: A parent function is the most basic function from which a family of similar functions is derived. By performing various operations like addition, subtraction, multiplication, etc. on a parent function you obtain a function that belongs to the same family.

Parent function graphs are the graphs of the respective parent function. Any graph can be graphically represented by either translating, reflecting, enlarging, or applying a combination of these to its parent function graph.

Now, let’s find out in more detail about the parent functions and parent graphs of the following types of equations

1.     Linear

2.     Quadratic

3.     Cubic

4.     Exponential

5.     Inverse

6.     Square Root

7. Absolute Value

*Note that, in this guide, y= and f(x)= are used interchangeably and mean the same thing.


The Linear Parent Function

Linear Functions are one of the simplest types of functions you will learn. The general form of a single-variable linear function is f(x) = mx + b, where m, and b are constants, with a being non-zero.

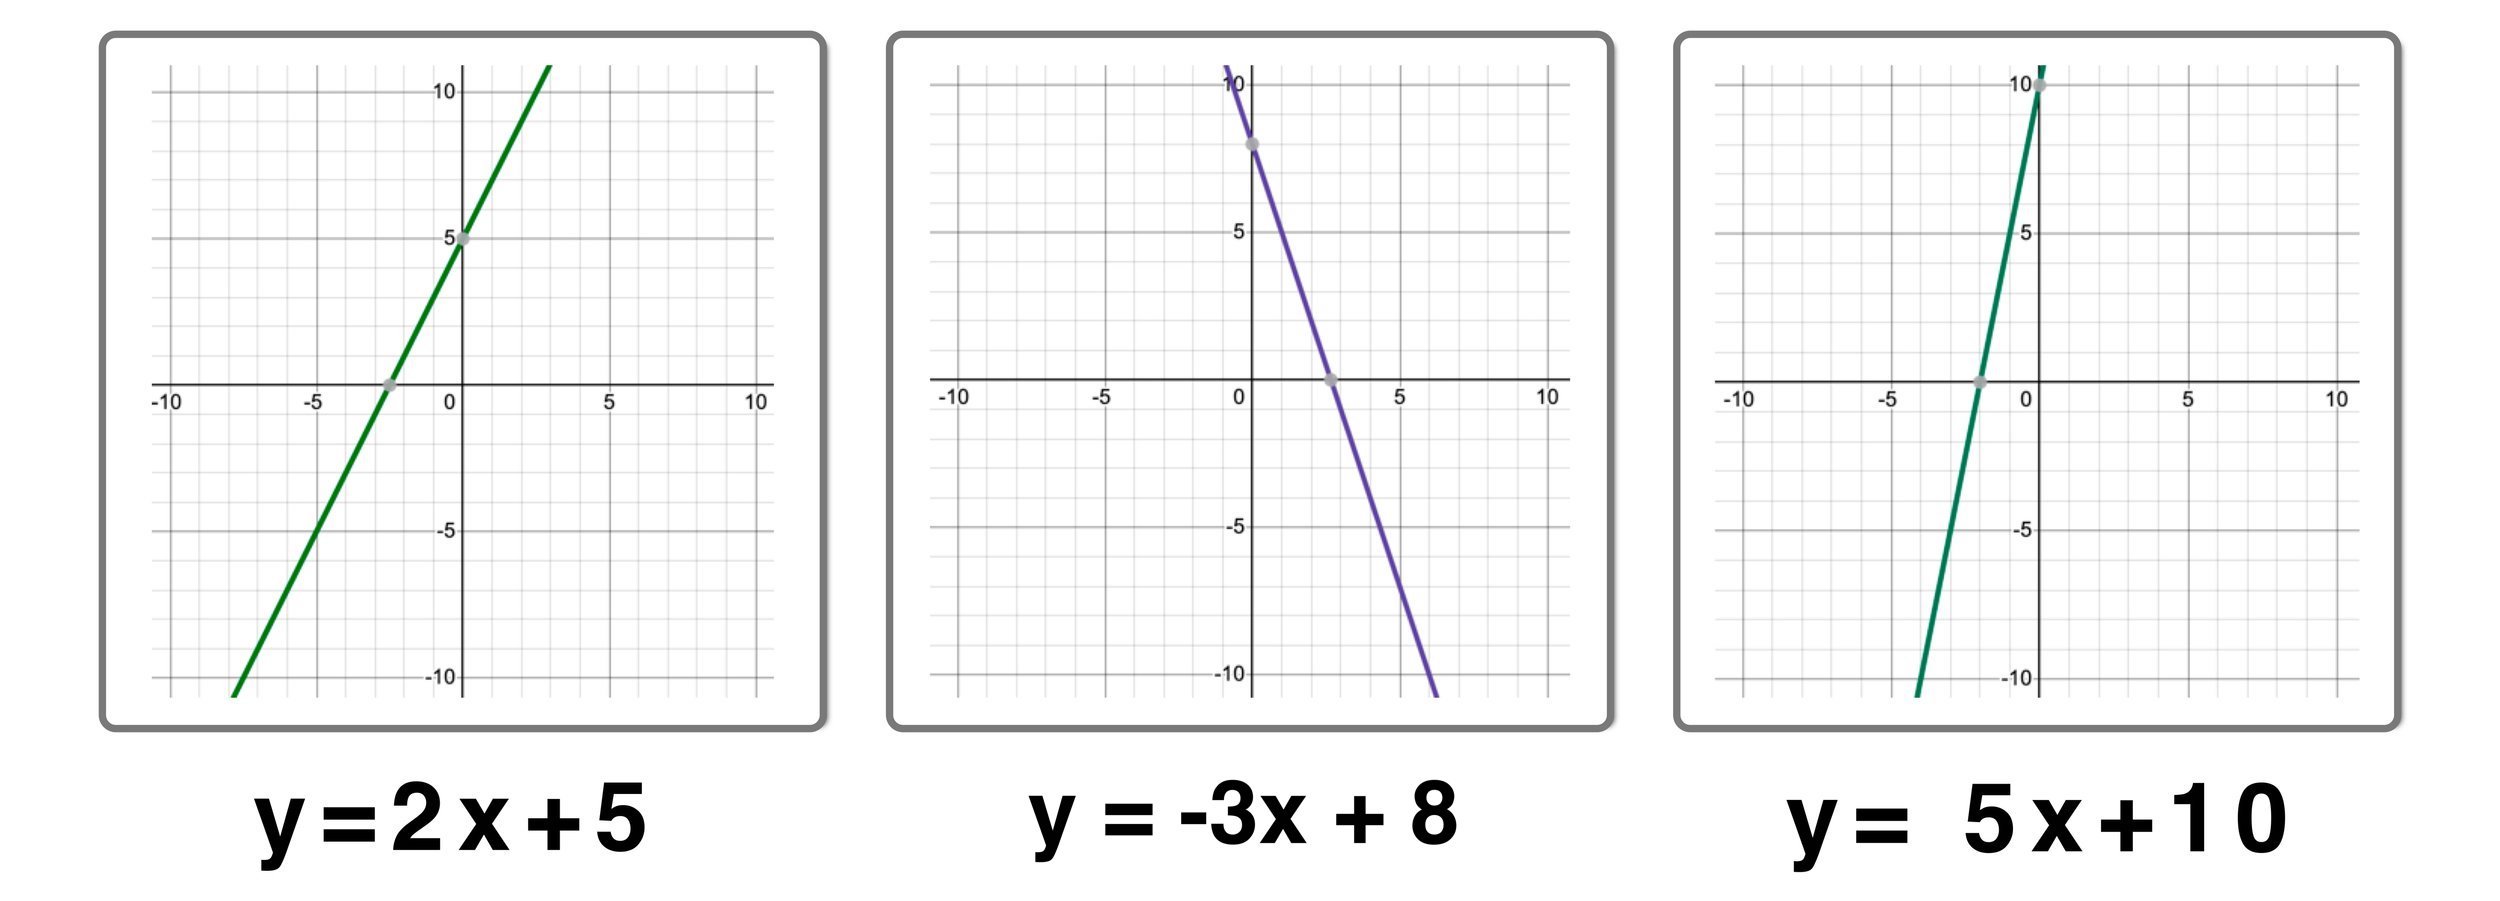
Some examples of linear functions that are derived from the linear parent function are:

  • f(x) = 2x +5

  • f(x) = -3x +8

  • f(x) = 5x + 10

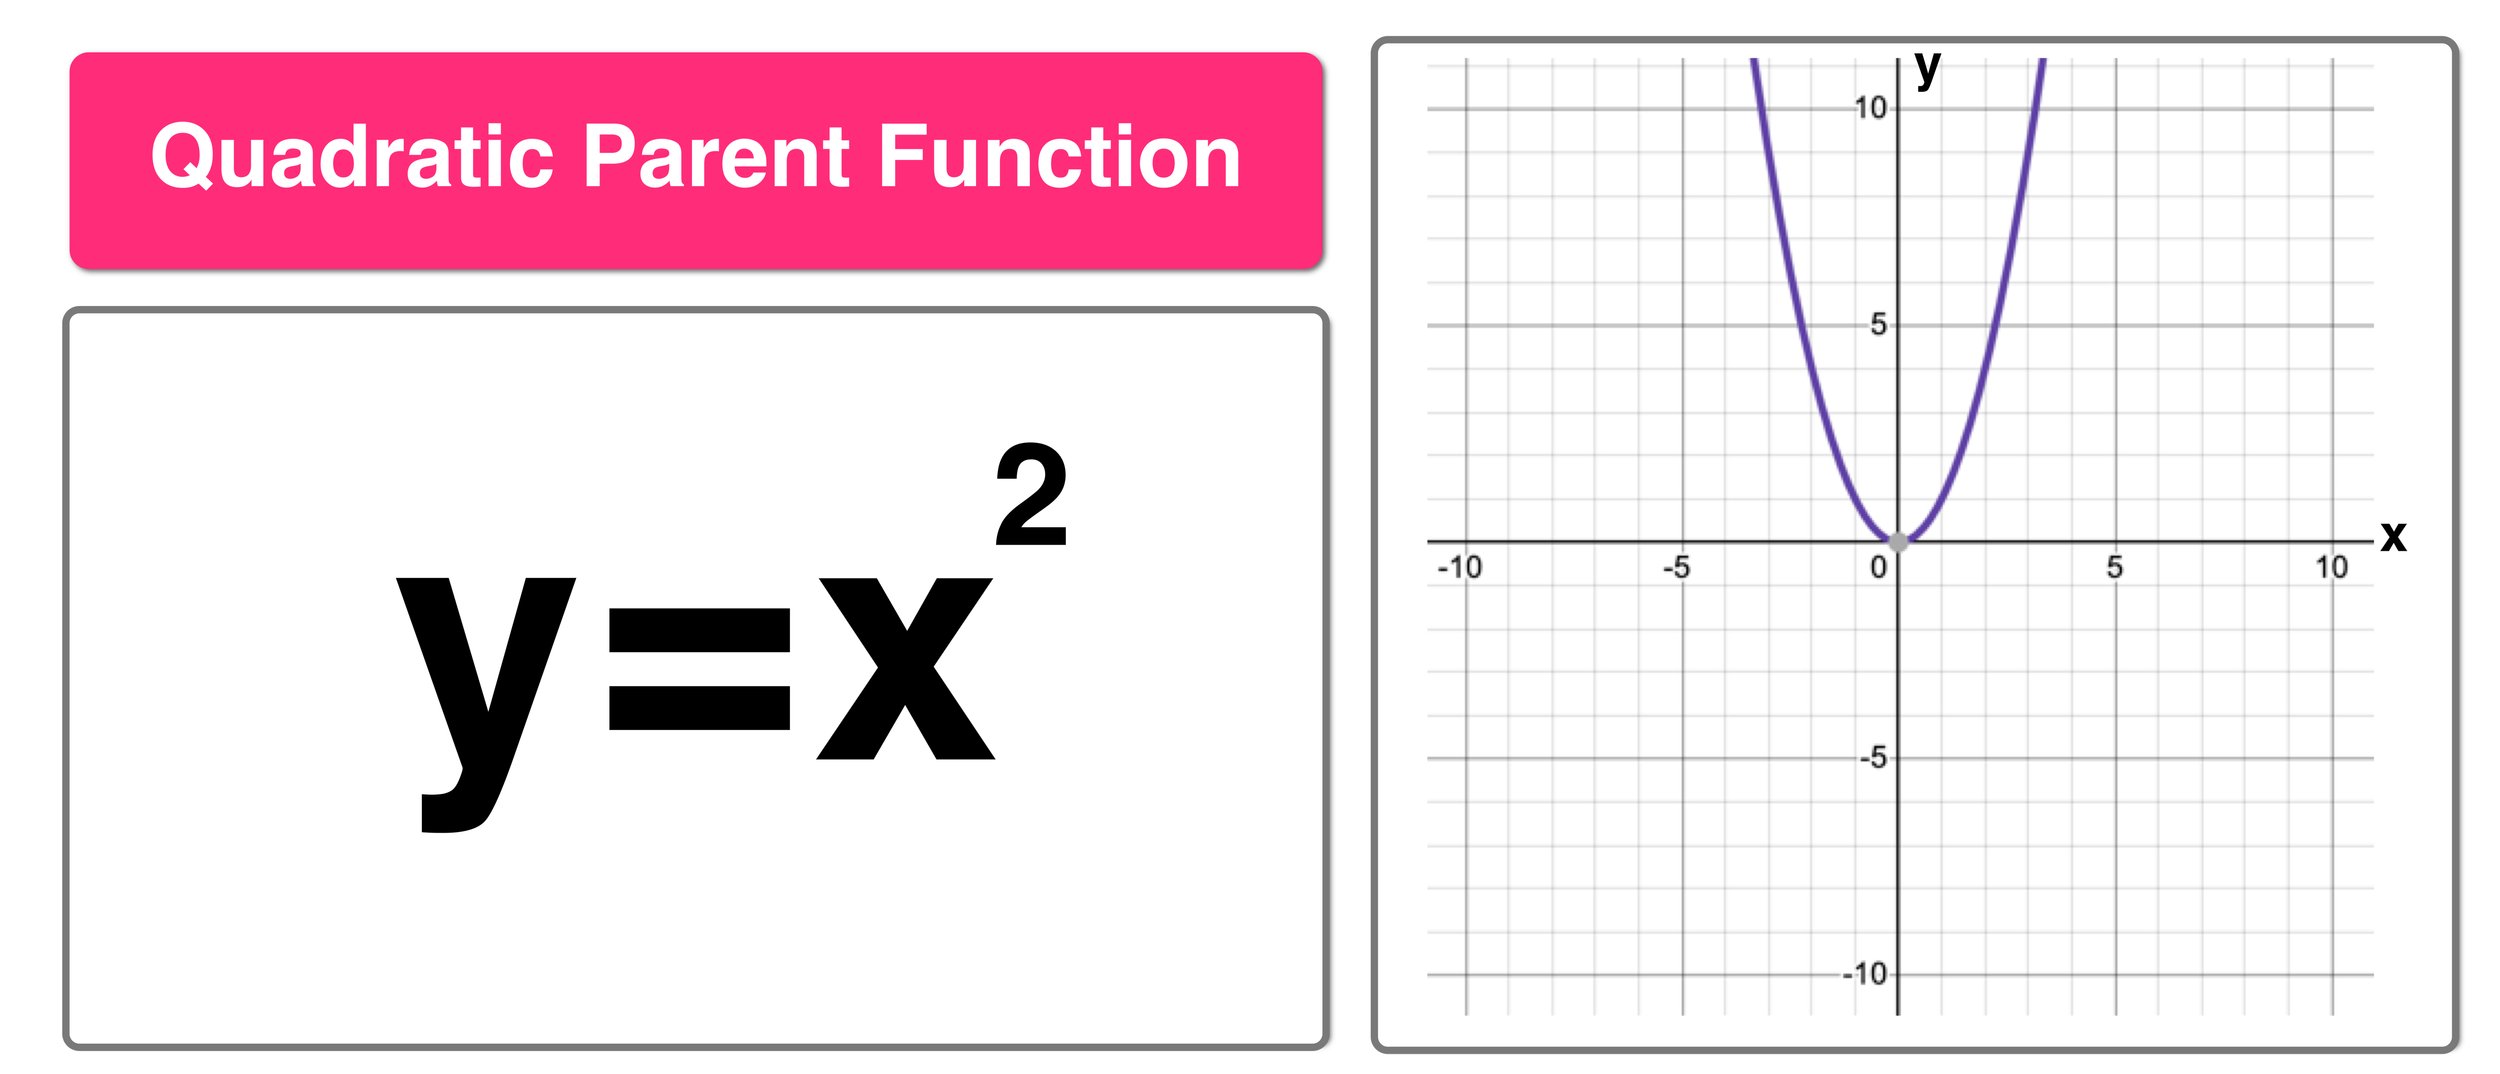
The parent linear function is y = x, which is the simplest form from which members of the linear function’s family can be derived.

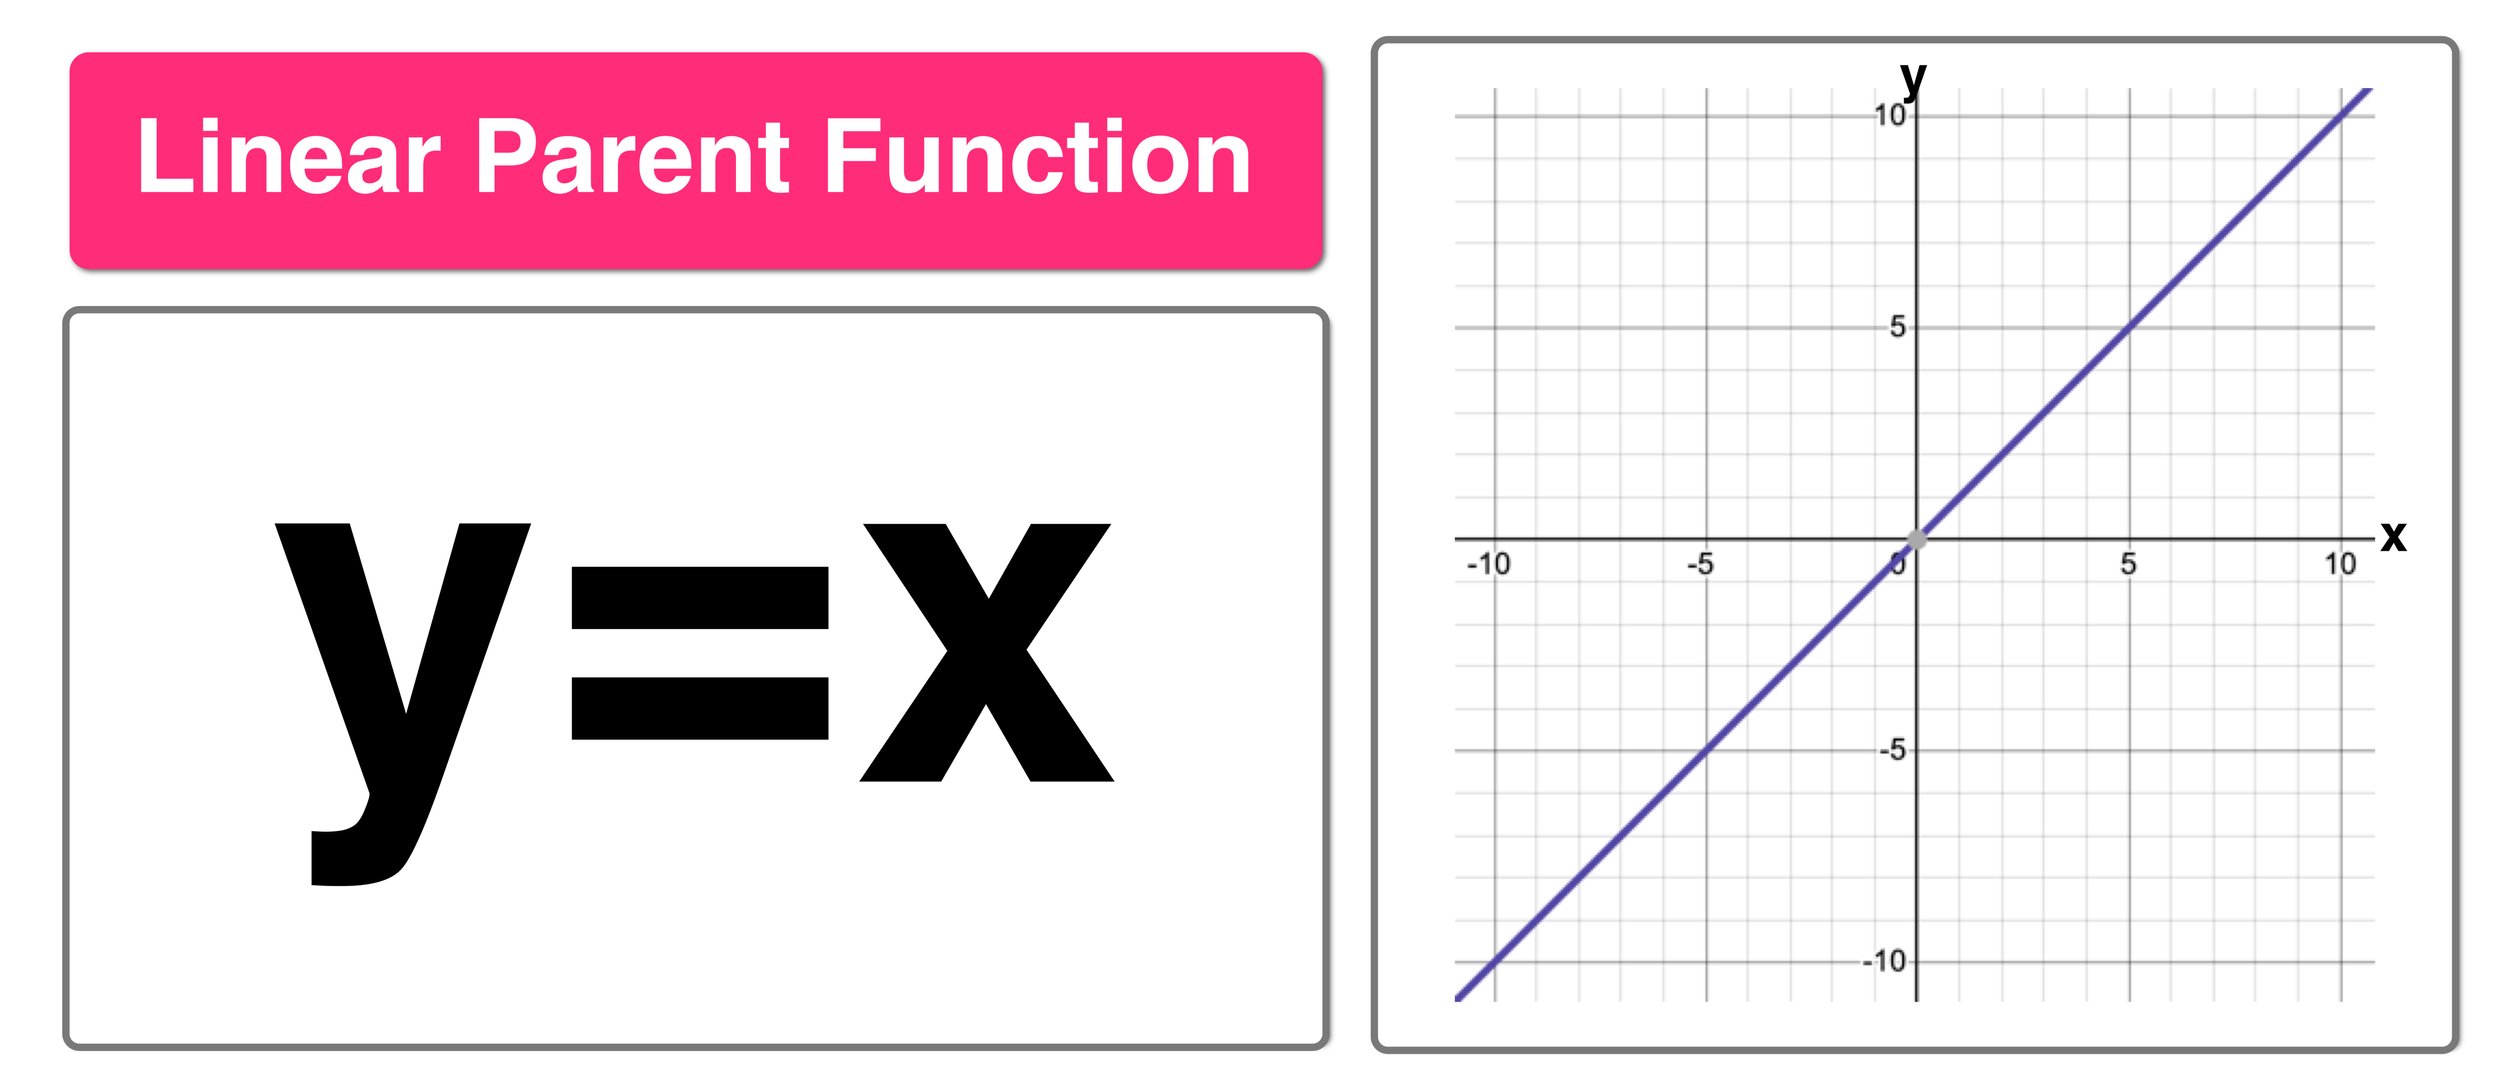
Linear Parent function : f(x) = x

The parent function graph of linear functions is a straight line with a slope of 1 and passes through the origin.

The graph of a function whose parent function is linear will always be a straight line. The features that uniquely identify each member in the family of linear functions are its slope and intercepts.

Examples of Linear Functions:


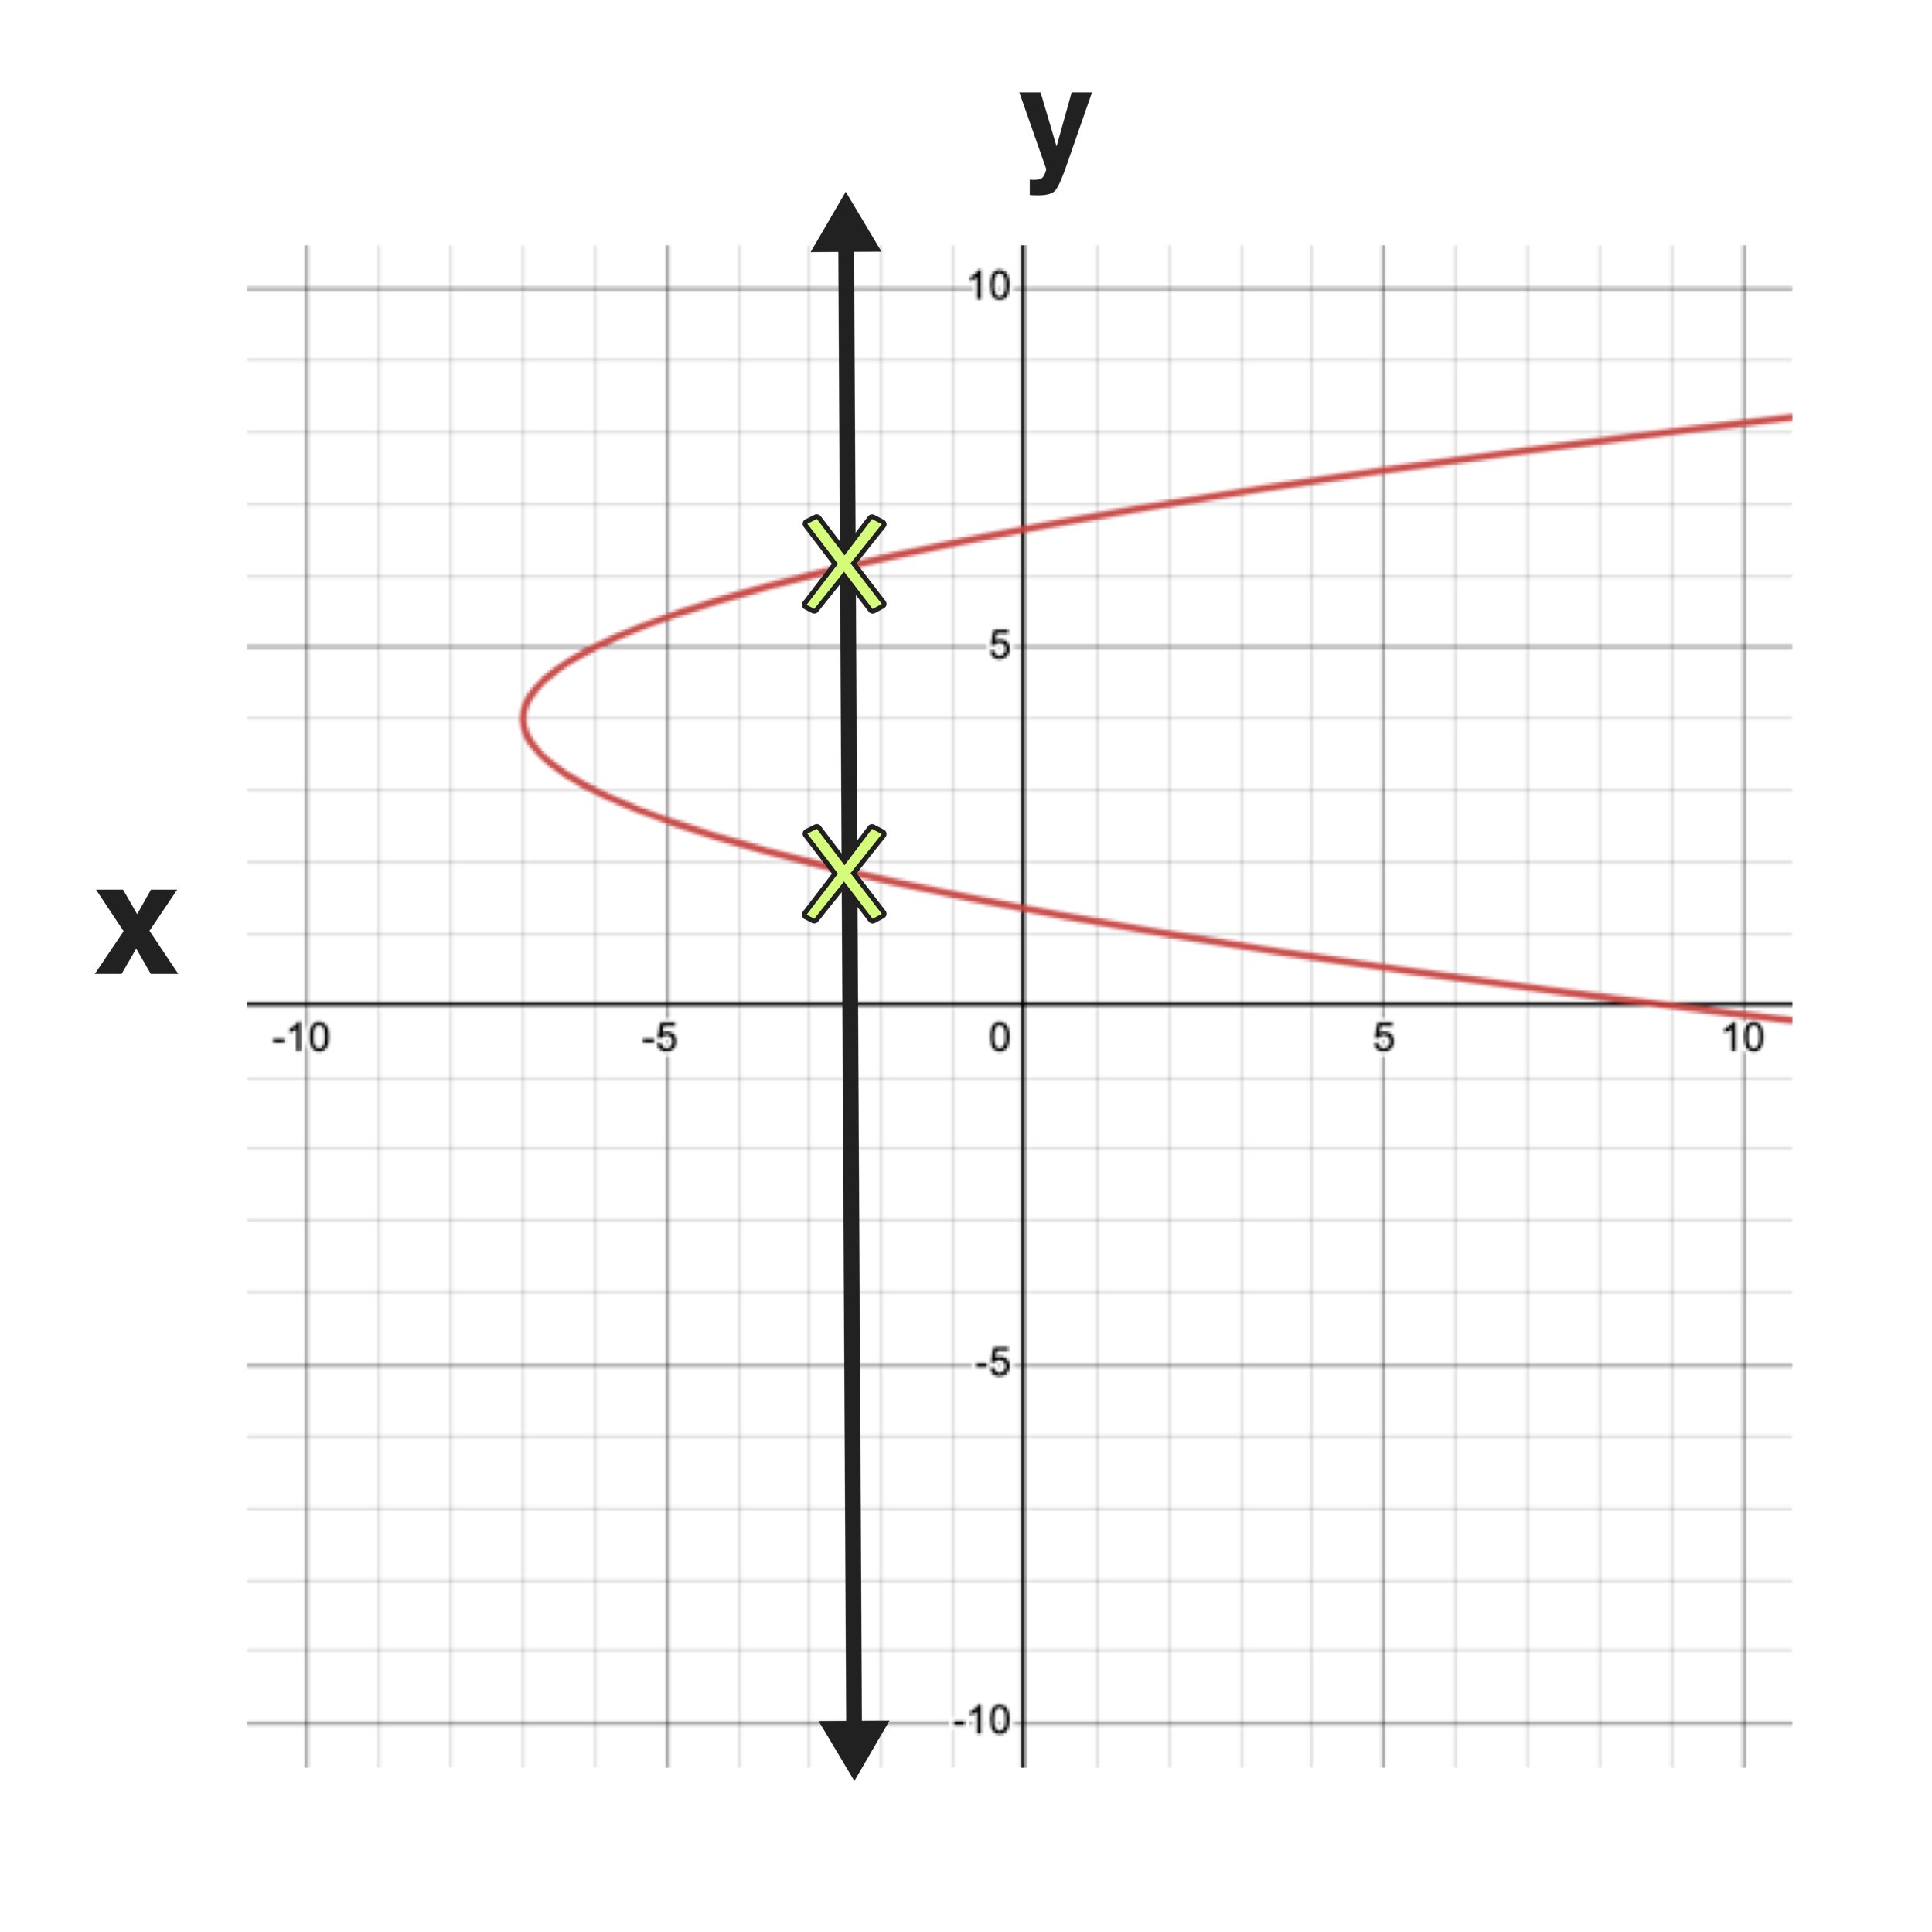
The Quadratic Parent Function

Quadratic functions are functions of the 2nd degree. The general form of a single-variable quadratic function is f(x) = a*x^2 + b*x + c, where a,b, and c are constants and a is non-zero.

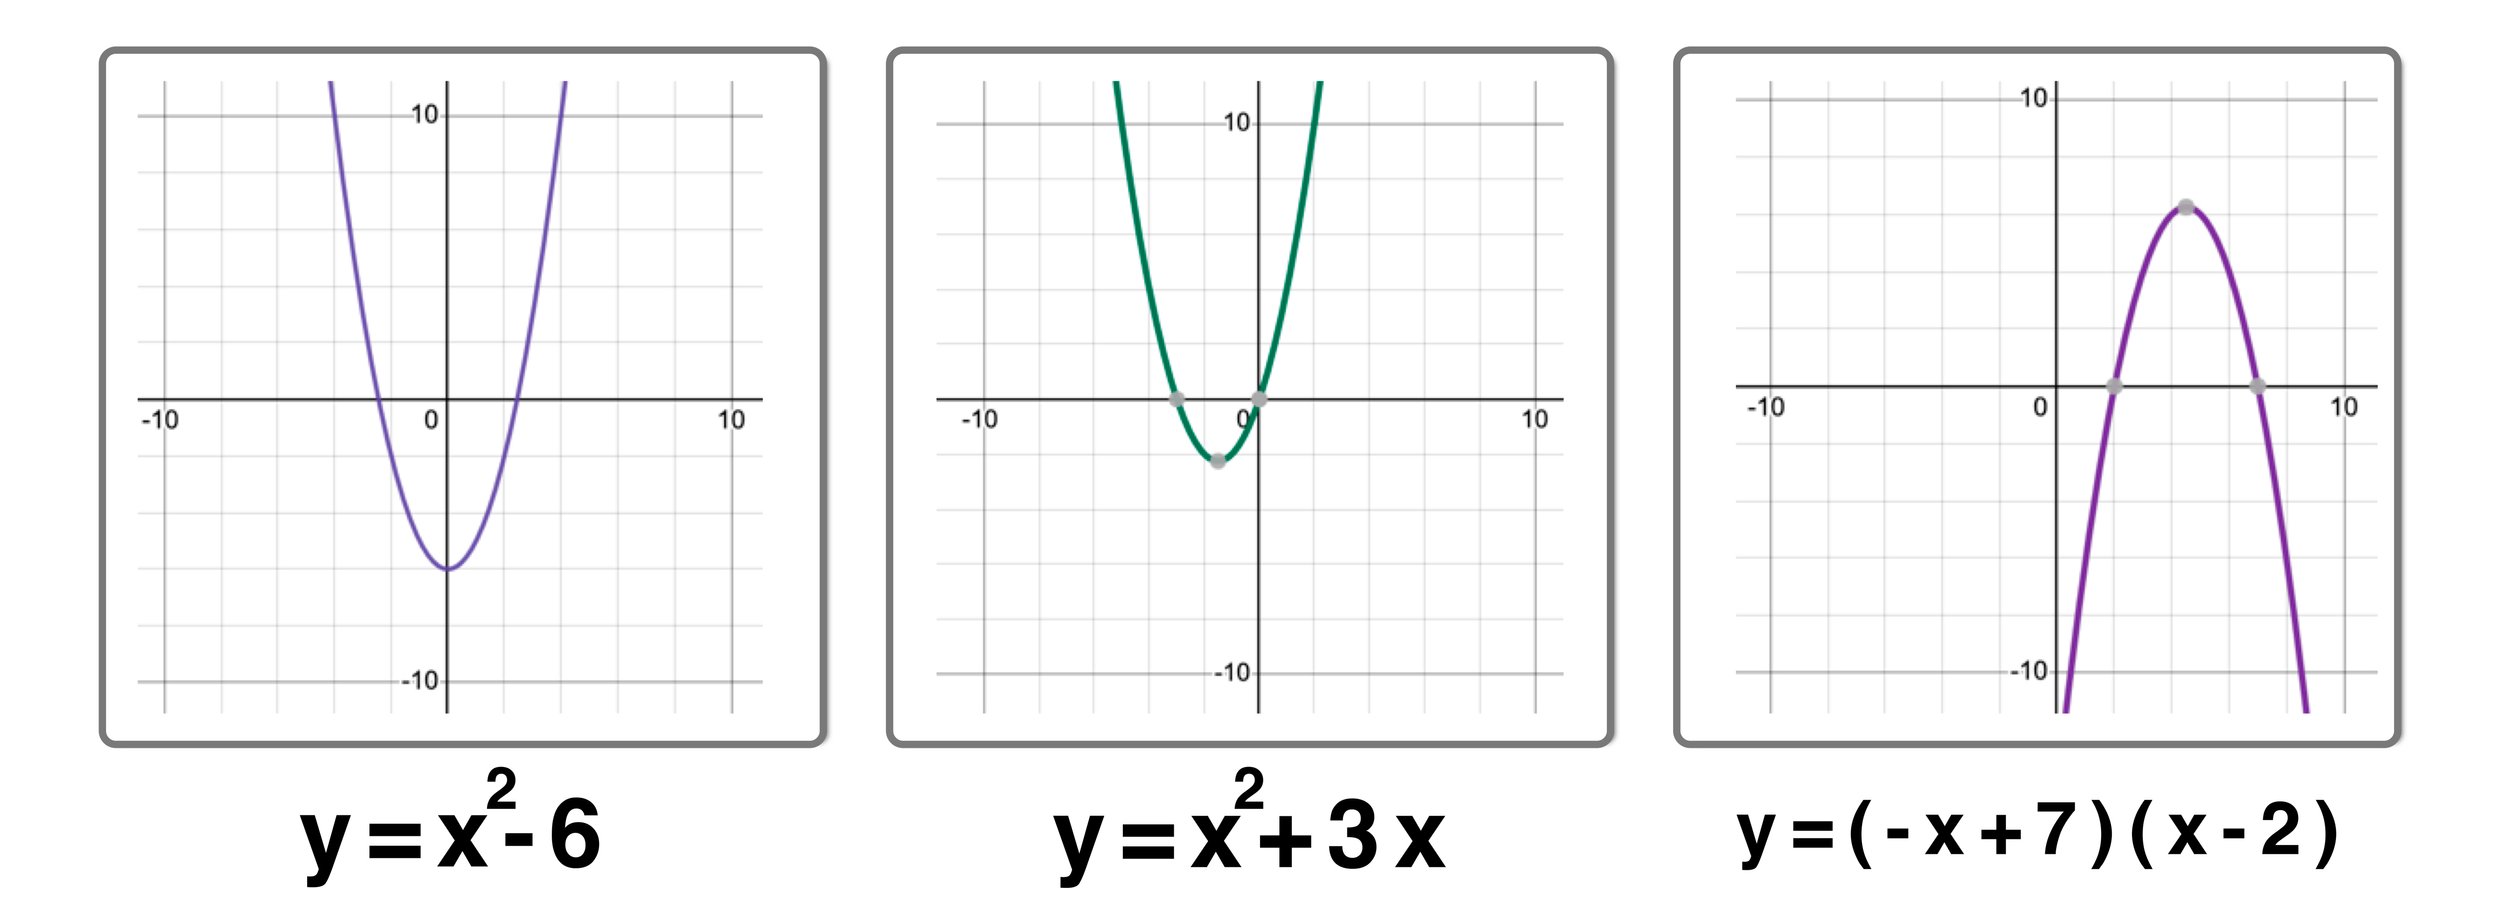
Here are some examples of quadratic functions that are derived from the quadratic parent function:

  • f(x) = x^2 - 6

  • f(x) = x^2 + 3x

  • f(x) = (-x+7)(x-2)

The quadratic parent function is f(x) = x^2

The parent function graph of quadratic functions is a parabola shape.

When we plot the graphs of the above-mentioned examples of quadratic functions, you can clearly see that they too have derived the characteristic parabola shape from their quadratic parent function.

Examples of Quadratic Functions:


The Cubic Parent Function

Cubic functions are third-degree functions. The general form of a single-variable cubic function is f(x) = a*x^3 + b*x^2 + c*x +d, where a,b,c, and d are arbitrary constants and a is non-zero.

A few examples of cubic functions that are derived from the cubic parent function include:

  • f(x) = x^3 + 4

  • f(x) = -x^3 + 3

  • f(x) = 2x^3 - 3x^2 - 6x

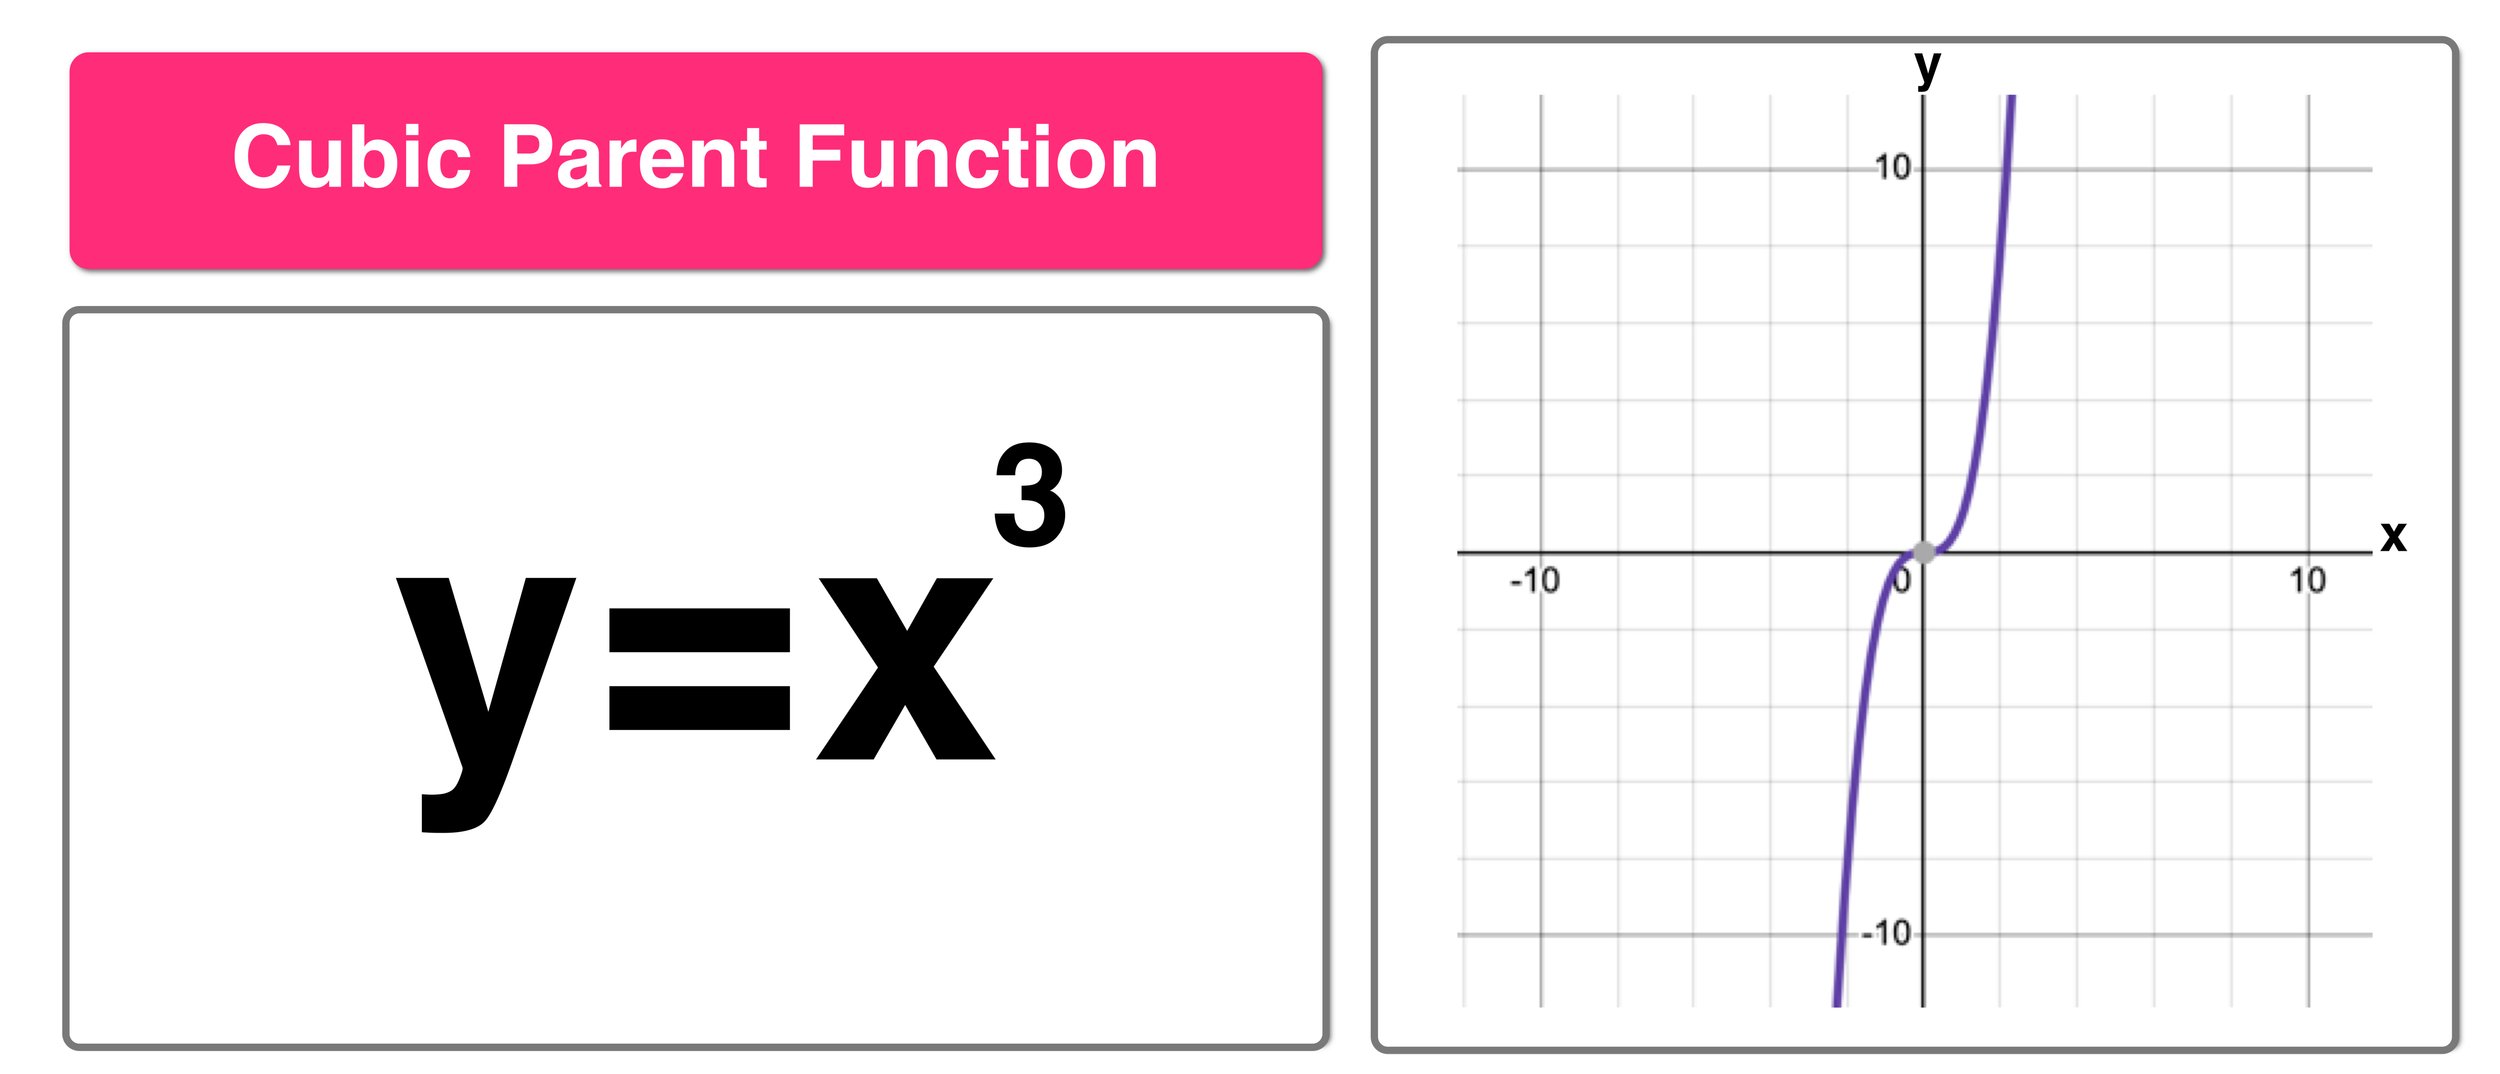
 The cubic parent function is f(x) = x^3

If we take the third cubic function example, y = 2x^3 - 3x^2 - 6x, it will seem that the function is drastically different from the parent function yet visually the parent function graph, and the graph of the cubic function below aren’t far apart (see the graphs below for reference)

Examples of Cubic Functions:

As with visual similarity, functions also show behavioral similarity with their parent functions, which is why it is important to learn about them.


The Exponential Parent Function

Exponential functions are quite often used to mathematically represent the growth and decay of populations, investments, etc. The parent exponential function is f(x) = b^x, where b, commonly referred to as the base, is a positive non-zero number.

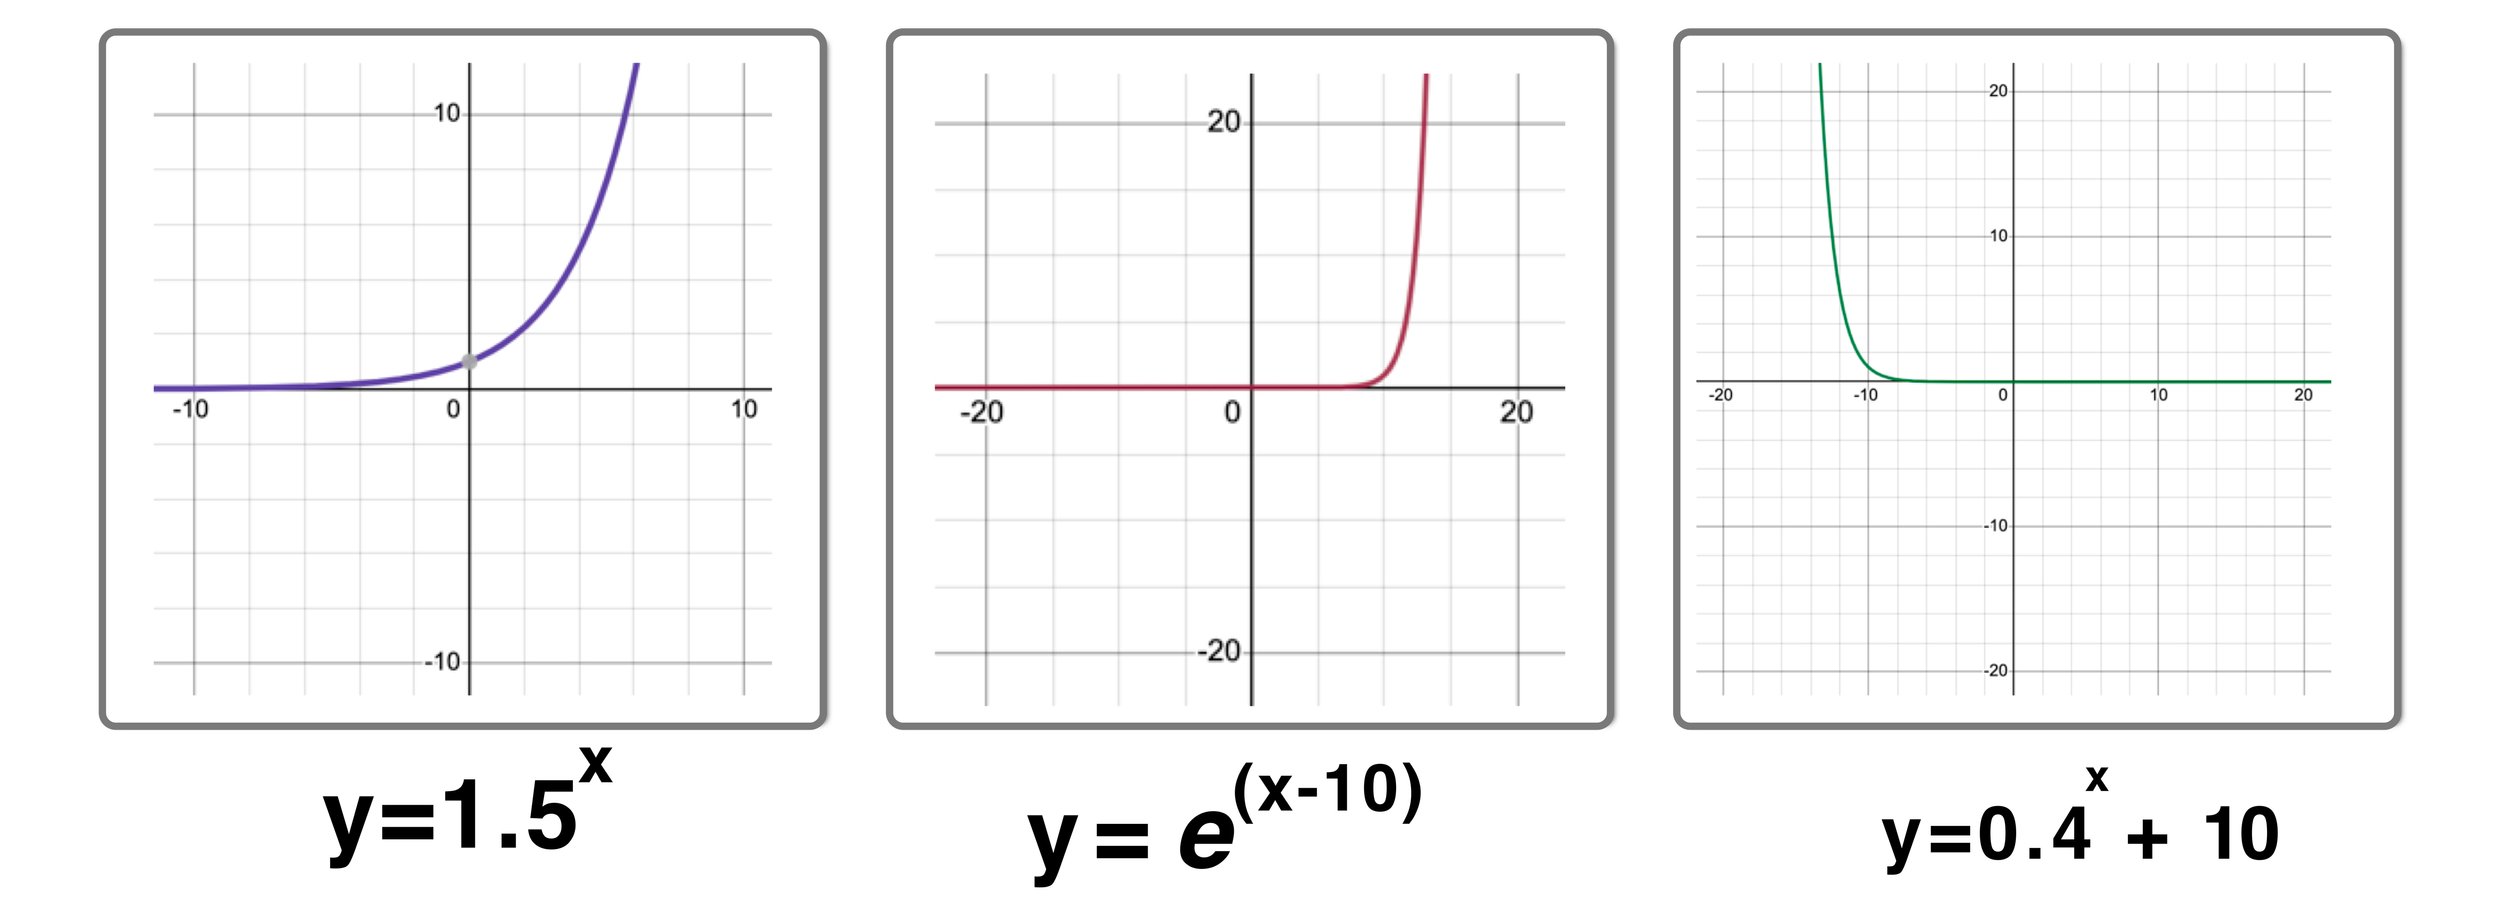
Examples of exponential functions that are derived from the exponential parent function include:

  • f(x) = 1.5^x

  • f(x) = e^(x - 10)

  • f(x) = 0.4^x + 10

You can look for variables present in the exponents of a function to easily identify if a function’s parent function is exponential.

The parent exponential graph f(x) = e^x is shown below:

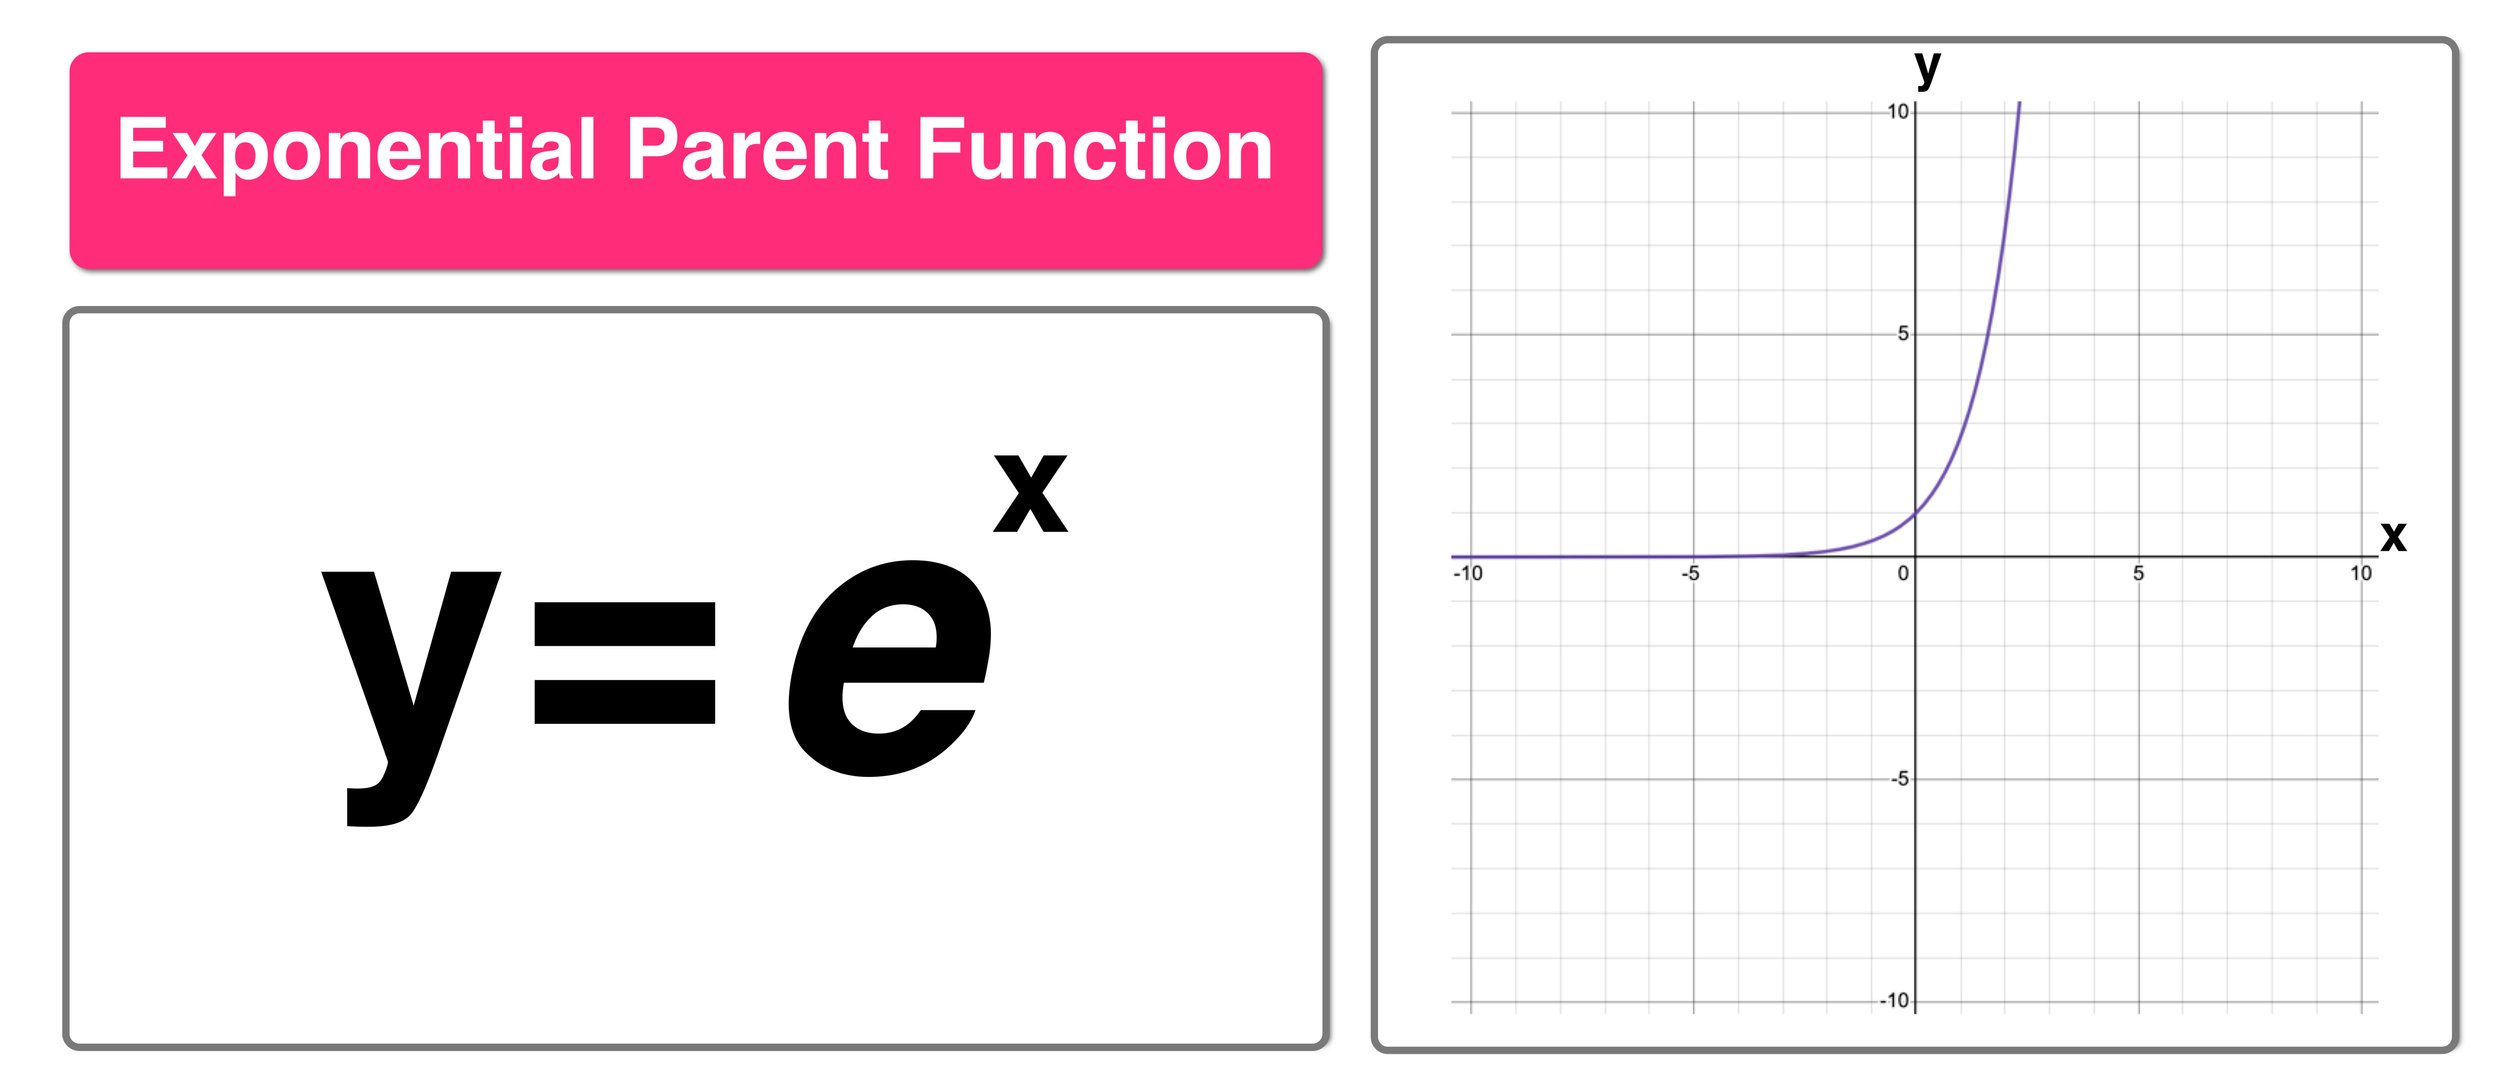
Note that in the parent exponential graph the graph tends towards y = 0 as x goes towards negative infinity. This is the horizontal asymptote of the function. You will come across horizontal asymptotes for functions whose parent function is exponential.

 Next, let’s see how the example exponential functions graphs look. See if you can determine their horizontal asymptotes.

Examples of Exponential Functions:


The Inverse Parent Function

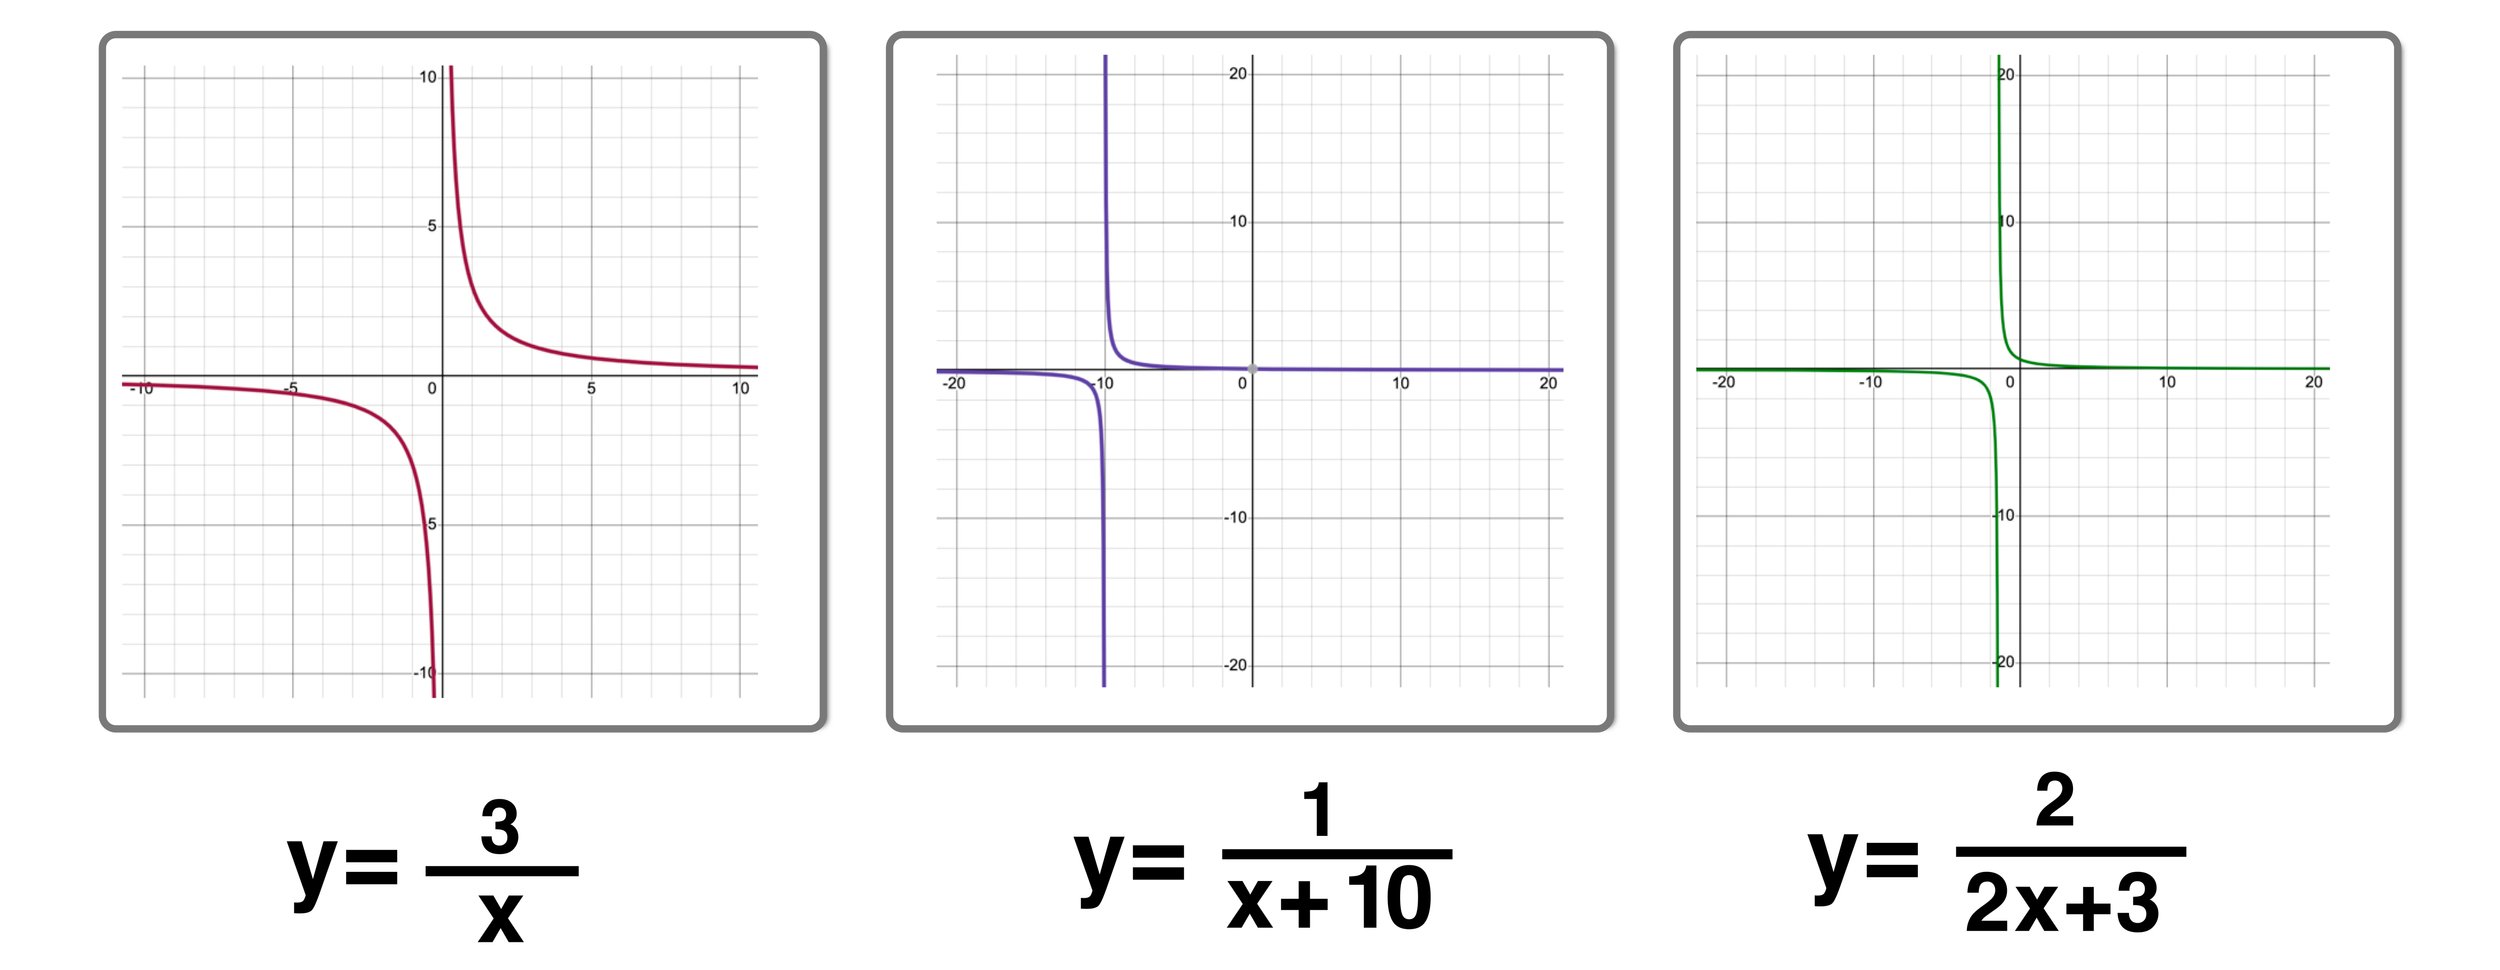
Inverse functions also known as reciprocal functions have the variable (x) at the denominator of the function.

The parent inverse function is f(x) = 1/x.

Some examples of functions that fall under the family of inverse functions that are derived from the inverse parent function include:

  • f(x) = 3/x

  • f(x) = 1/(x+10)

  • f(x) = 2/(2x+3)

The parent inverse function has a vertical asymptote at the y-axis (x = 0), which can be seen in the behavior of the graph as x tends to 0.

Hence the presence of vertical asymptotes in a graph may be an indication that the parent function is inverse. Do you recognize the vertical asymptotes in the graphs of the example inverse functions below?

Examples of Inverse Functions:


The Square Root Parent Function

The parent function of square root functions is f(x) = sqrt(x).

The following are examples of square root functions that are derived from the square root parent function:

  • f(x) = sqrt(x+1)

  • f(x) = sqrt(3x -9)

  • f(x) = sqrt(-x)

The parent square root function has a range above 0 and a domain (possible values of x) of all positive real values. Therefore, the parent graph f(x) = sqrt(x) looks as shown below:

The graphs of the square root function examples also have their domains restricted.

Examples of Square Root Functions:

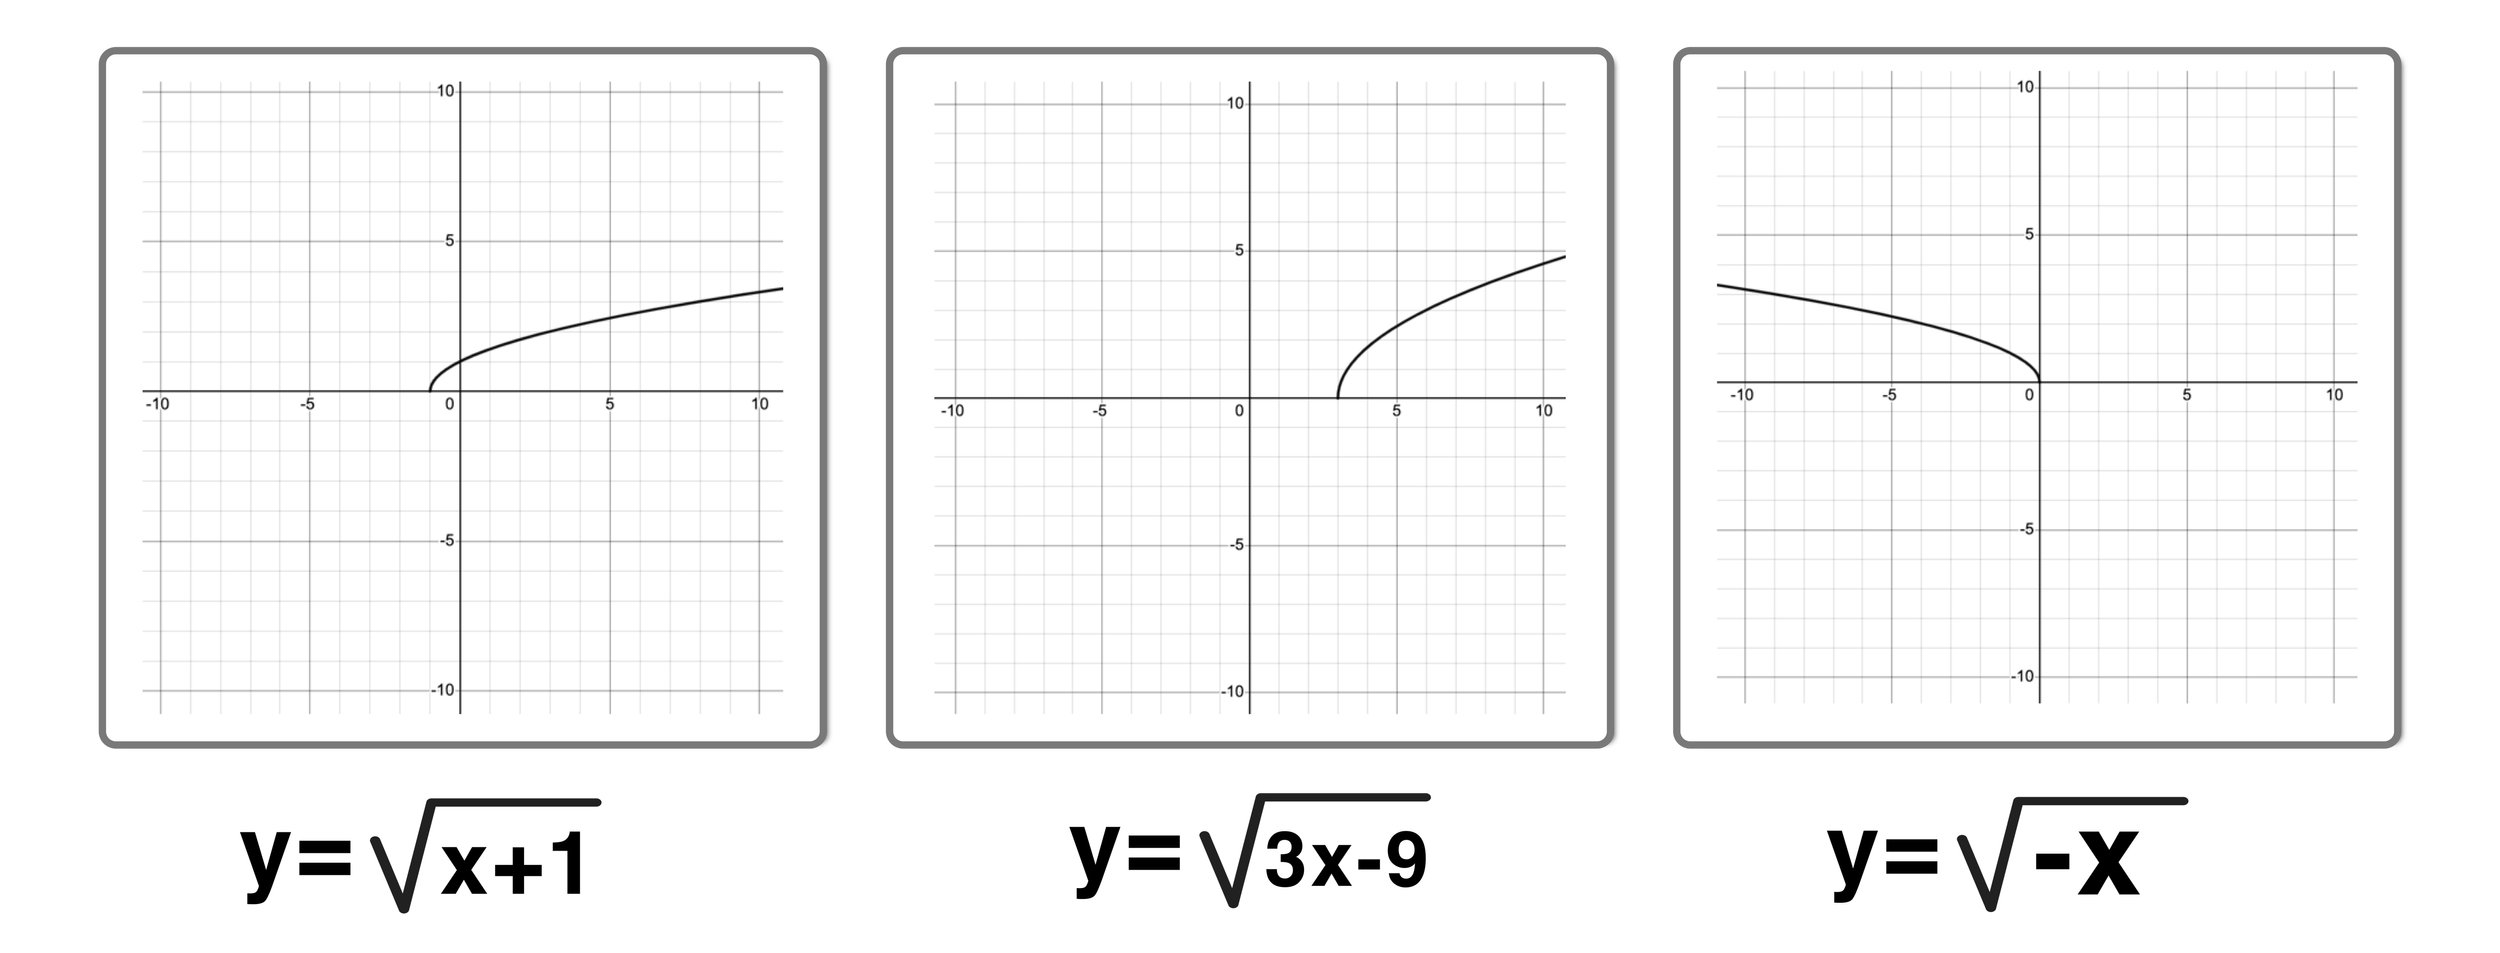
*Note: From the types of parent functions discussed in this blog, only functions derived from the square root and inverse parent functions inherit domain restrictions. You can use this pattern to distinctly identify functions from others.


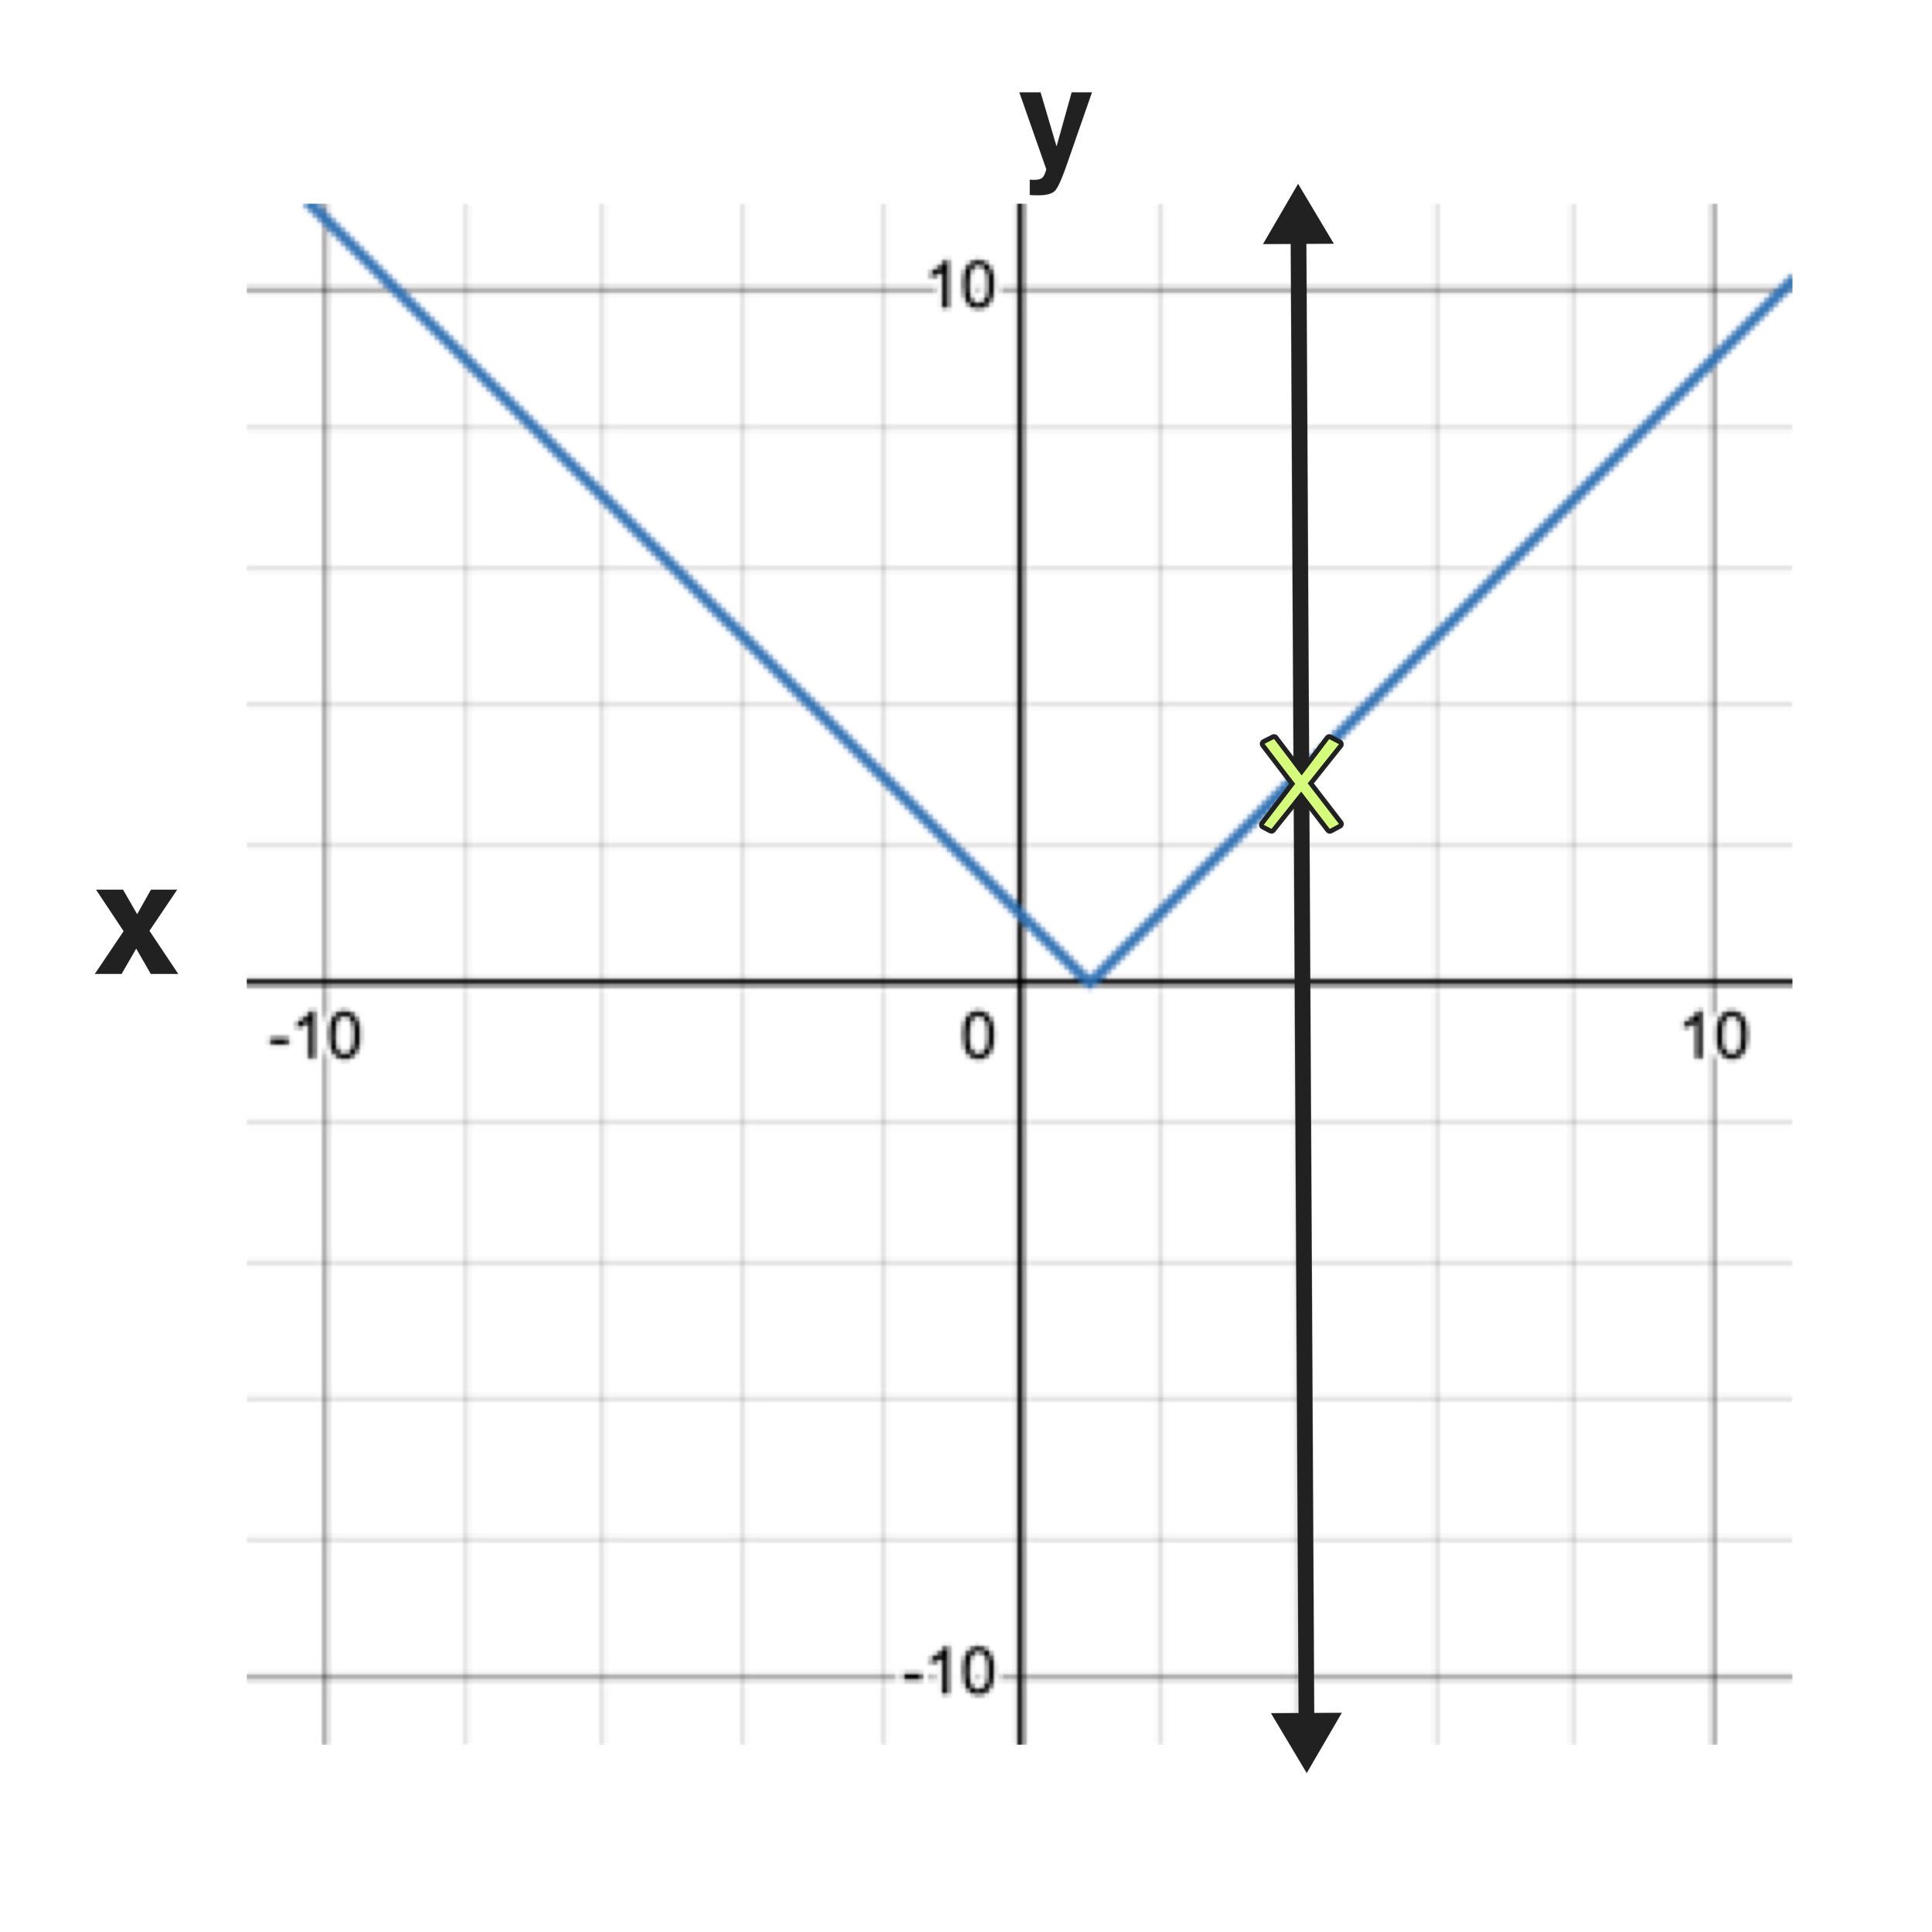
The Absolute Value Parent Function

The final parent function covered in this guide is the absolute value parent function f(x) = | x |.

The following are examples of absolute value functions derived from the absolute value parent function:

  • f(x) = | x+4 |

  • f(x) = | 3x | - 4

  • f(x) = - | x - 1 | + 8

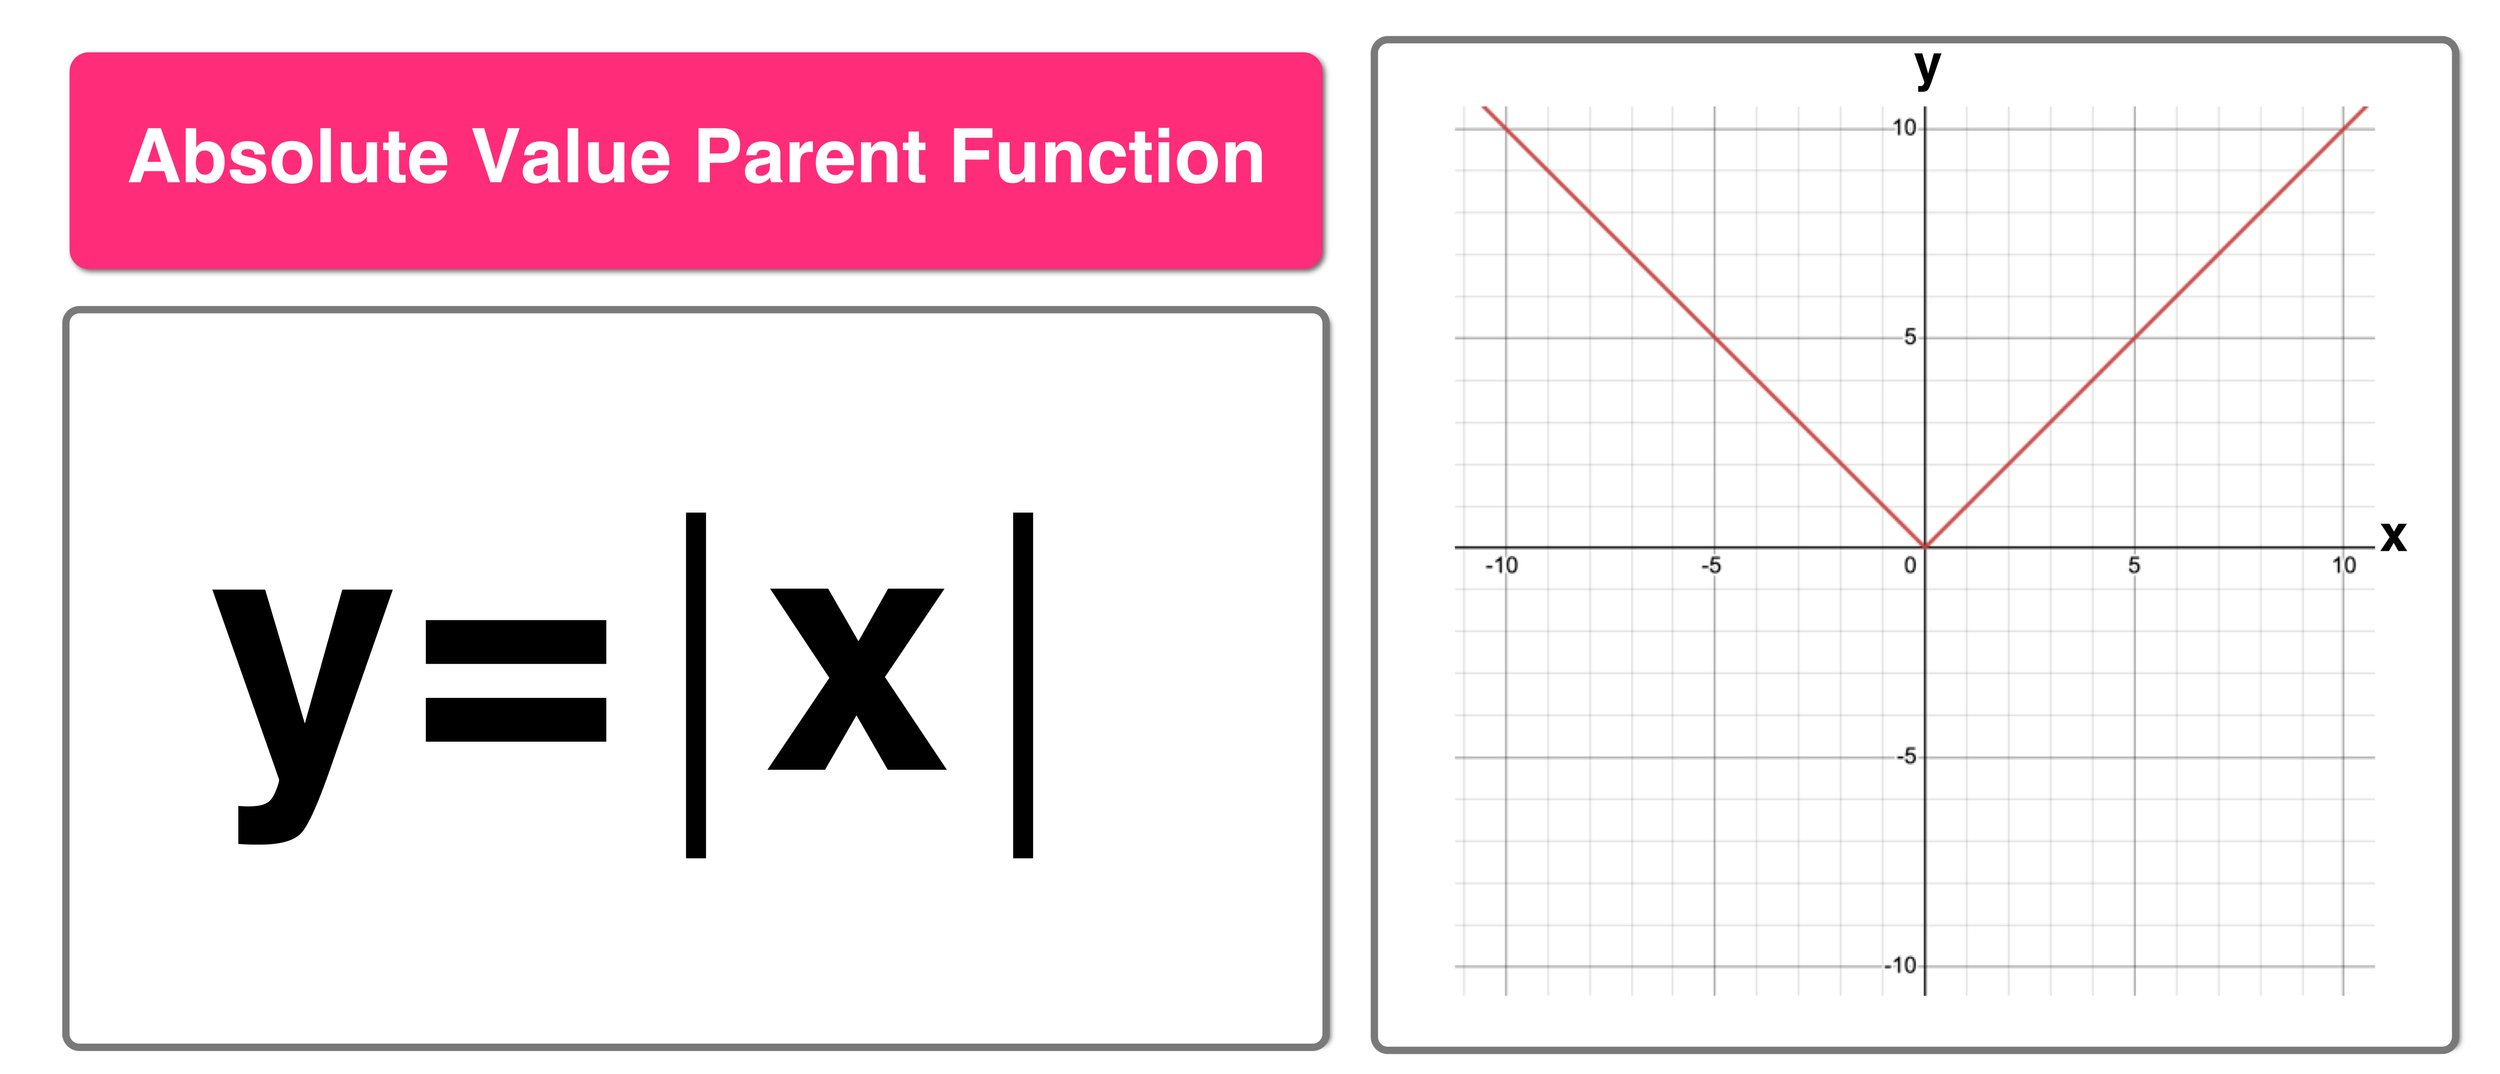
The absolute value parent function is defined by its V-shape with a sharp and pointy vertex. Take a close look at the absolute value function examples below to see their relationship to the parent function.

Examples of Absolute Value Functions:


Conclusion: Parent Functions and Parent Graphs

There are infinitely many functions, yet all functions can be classified as a derivation of a particular parent function. Functions tend to inherit behaviors and characteristics such as domain restrictions, range, asymptotes, etc. from their respective parent function. Hence, understanding the patterns of parent functions and their graphs will make it easier for us to handle complicated functions.

Need More Help?

Check out our animated video lesson on the parent functions and their transformations:

Keep Learning:

4 Comments

The Vertical Line Test Explained in 3 Easy Steps

Comment

The Vertical Line Test Explained in 3 Easy Steps

What is the Vertical Line Test in Math?

Key Question: What is the vertical line test function and how can it be used?

Learning how to identify whether or not a given relation is a function is an extremely important math skill (most notably in pre-algebra and algebra). Luckily, there is a simple and handy tool called the vertical line test that you can always use to see if a relation can be considered a function or not just by looking at its graph.

This free Vertical Line Test step-by-step guide will teach you how to figure out whether or not a relation is or is not a function by looking at its graph and using a simple mathematical tool called the vertical line test.

Before you learn how to use the vertical line test, we will do a quick review of some very important vocabulary and definitions related to functions and relations.

Are you ready to get started?

Vertical Line Test Definitions and Vocabulary

What is a relation?

Definition: A relation is how a set of inputs and outputs of a system are related to each other. Mappings and graphs are the most common ways of representing relations. The figures below show a graphic and map representation of the relation between a set of numbers and the square of those numbers.

Figure 01: Relation Mapping

Figure 02: The graph representing the relation in Figure 01.

What is a function?

Definition: A function is a relation between a set of inputs and outputs where, for every input, there is one (and only one) output. In other words, a function is a relation where every input has only one output.

If this is confusing, observe the mappings in Figure 03 and Figure 04 below for more insight.

Figure 03: The relation is a function.

Figure 04: The relation is NOT a function.

The relation mapping in Figure 03 represents a function because every input (or x-value) has only one unique output (or y-value).

The relation mapping in Figure 04 does not represent function because at least one of the inputs (in this case 6) has more than one output. If you look at the mapping, you will notice that 6 has two outputs: 1 and 3. Thus, the relation in Figure 04, by definition, is not function.

Keep this information in mind as we move on and extend your understanding of relations and functions to looking at graphs and learning how to apply the vertical line test.

What is the difference between a relation and a function?

Functions are a subset of relations. Simply put, all functions are relations, but not all relations are functions.

In other words, a relation represents the relationship between an input and an output, while a function—more specifically—is a type of relation where there is only one output for each input.

What is the Vertical Line Test Function?

Now that you understand how to determine whether or not a relation is a function by looking at a mapping, you are ready to learn to make this same determination just by looking at a relation’s graph and using a tool called the vertical line test.

The Vertical Line Test helps you to determine if a given relation is a function. Now, let's find out how the vertical line test works with realistic examples.

Again, for a relation to be a function, the relation must have exactly one output for a given input. Let's revisit the relations shown in Figure 03 and Figure 04, but this time we will represent them graphically:

Figure 05: The graph of the relation in Figure 03, which was, by definition, a function.

Figure 06: The graph of the relation in Figure 04, which was, by definition, not a function.

We already know that the graph in Figure 05 represents a function and that the graph in Figure 06 does not represent a function because we already applied the definition of a function to the corresponding mappings.

But what if we had to make this determination using only the graph without the mappings? This is where the vertical line test comes into play.

The Vertical Line Test Explained in 3 Easy Steps

The vertical line test is a simple and straightforward tool for determining whether not the graph of a relation represents a function or not.

Applying the vertical line test is as easy as following these 3 easy steps:

Step One: Observe the given graph and draw one or multiple vertical lines through the graph.

Step Two: Note how many times the vertical line(s) that you drew intersected the graph (either coordinate points or a line/curve).

Step Three: Based on the number of intersections, determine whether or not the relation is a function.

  • If your vertical line intersects the graph only once, then the relation is a function.

  • If your vertical line intersects the graph more than once at any point, the relation is not a function.

We can apply the vertical line test to the graphs from Figure 05 and Figure 06 below to confirm what we already knew (that one graph represents a function and the other does not).

Figure 07: The vertical line test confirms that the relation is a function because there is only one intersection point.

Figure 08: The vertical line test confirms that the relation is a not function because there are multiple intersection points.

Notice how the vertical line drawn on the graph in Figure 07 only has one intersection point. Furthermore, there are no other areas on the graph where you could draw a vertical line where there would be more than one intersection point. Therefore, the graph represents a function.

Notice how the vertical line drawn on the graph in Figure 08 has multiple intersection points (namely through (6,1) and (6,3)), therefore this graph does not represent a function.

Now that you understand how the vertical line test works, let’s apply it to three more examples…

Vertical Line Test Examples

Directions: Use the vertical line test to determine whether or not the graph of each relation is a function.

Example A: Is the relation a function?


We can determine whether or not this graph represents a function by drawing one (or multiple vertical lines) through the graph to see if there is any point where the line intersects the graph more than once (if it does, then the relation is not a function).

The vertical line test shows…

Here we can clearly see that the relation fails the vertical line test and that the graph does not represent a function because there are multiple intersection points.

Final Answer: The relation is not a function because it fails the vertical line test.

Example B: Is the relation a function?


Again, you can use the vertical line test to determine whether or not the graph above represents a function.

Here we can clearly see that the relation passes the vertical line test and that the graph represents a function because there is only one intersection point.

Final Answer: The relation is a function because it passes the vertical line test.

Example C: Is the relation a function?


Are you starting to get the hang of it? Go ahead and apply the vertical line test to see if the graph of the circle represents a function.

Here we can clearly see that the relation fails the vertical line test and that the graph does not represent a function.

Final Answer: The relation is not a function because it fails the vertical line test.

(This will always be the case with circles)

Example D: Is the relation a function?


Remember that the graph of a relation has to pass the vertical line test everywhere in order to confirm that the relation is a function.

For example, if you drew your vertical line at x=-10 as in Figure 09 below, you might incorrectly conclude that the graph passes the vertical line test (since there is only one intersection point).

But, if you draw multiple vertical lines, such as the one through x=2 in Figure 10 below, you will see that this graph actually fails the vertical line test.

Figure 09: Does the vertical line test pass everywhere?

Figure 10: If the vertical line test fails anywhere on the graph, then the relation is not a function.

Final Answer: The relation is not a function because it fails the vertical line test.

Conclusion/Recap:

The vertical line test is a simple, yet effective tool that can be used to determine whether or not the graph of any given relation represents a function (a specific type of relation where for every input there is one and only one output). To make this determination, simply draw a vertical line through the graph and see how many times the vertical line intersects with the graph of the function. If the vertical line only intersects with the graph one time at any given point, then the graph represents a function. However, if the vertical line intersects with the graph at any point more than once, then the graph does not represent a function.

Recap:

Search Tags: vertical line test, vertical line test function, vertical line test examples, the vertical line test, vertical line test definition math, vertical line test to determine function, vertical line test practice

Keep Learning:

Comment

10 Free Counting Worksheets for Kindergarten

Comment

10 Free Counting Worksheets for Kindergarten

10 Free Counting Worksheets for Kindergarten

A Post By: Anthony Persico

Are Your Kindergarten Students Ready for These Fun and Engaging Counting Worksheets (with answer keys)?

One of the most fundamental and important math skills is basic counting. This key skill is first introduced at the pre-school and kindergarten levels and forms as the foundation of all math topics that follow (counting beyond single digits, grouping, addition, subtraction, working with money, etc.).

While there are tons of free kindergarten math worksheets available online, they are not all created the same. Many free worksheets are simply bland and uninteresting, leaving much to be desired and often leading children to start their mathematics journey off on the wrong foot. After all, we never want our students to see mathematics as a dull or boring subject (when it is, in fact, quite the opposite).

However, if you are looking for free counting worksheets for kindergarten students that are actually fun and engaging, then you’re in the right place. In today’s post, you will find 10 Free Counting Worksheets that can be download as pdf files, which are easy to print or share digitally.

These colorful worksheets give students an opportunity to practice and apply their counting skills in the context of “find the fib” or “two truths and one lie,” where students are given three counting examples or diagrams (two of which are true and one of which is false) and must figure out which choice is a fib. Why are these kinds of worksheets so effective for helping students to improve their counting skills? Because they require students to think deeply and actually apply their concepts of numbers and counting in a way that allows them to think critically and mathematically (and have fun at the same time).

Ready to see the results for yourself? Go ahead and download and share a few of our free counting worksheets with your kindergartners and see how they react. If you find the worksheets useful and would like to gain access to all of our kindergarten math activity libraries, you can click here to learn more about our membership program and sign up for a 7-day free trial.

Are you ready to download your Free Counting Worksheets for Kindergarten Students?

  • Use the links below to download and save each worksheet as a pdf file.

  • Each worksheet includes a sample image so you can preview the worksheet before downloading.

  • The second page of each worksheet includes an answer key.

  • While working on these worksheets, we recommend that you encourage your students to explain why they chose a statement as being untrue. You can take it a step further by asking them how they should change the statement to make it true.

  • Whenever you find an answer, ask the question “does this solution make sense?”


10 Free Counting Worksheets for Kindergarten

How to Download and Print:

Below you will find preview images and links to download all ten kindergarten math worksheets. There will also be a link denoted by a download symbol ⤓. Once you click on one of these links, the corresponding worksheet will download in a new window as a PDF file. Once the file is downloaded, you can save it to your personal device and or print the worksheet.

If you need a more detailed explanation of how to save and/or print any of these free pdf worksheets, please view our video tutorial by clicking this link.

*Note that you can click on any of the worksheet images to see an enlarged preview before you download.


Counting Worksheet #1:

Topic: Counting Numbers 1-5

Worksheet Download:

⤓ Click here to download your pdf worksheet

Answer: Choice B is a fib!

Suggested:

10 Free Kindergarten Math Worksheets for Ages 4+


Counting Worksheet #2:

Topic: Counting Numbers 6-10

Worksheet Download:

⤓ Click here to download your pdf worksheet

Answer: Choice B is a fib!

Suggested:

Do you want Free K-12 Math Resources, Lesson Plans, and Activities in your inbox every week?


Counting Worksheet #3:

Topic: Counting Numbers 1-10, Grouping

Worksheet Download:

⤓ Click here to download your pdf worksheet

Answer: Choice A is a fib!

Suggested:

11 Super Cute Math Jokes and Puns for Kids


Counting Worksheet #4:

Topic: Grouping, Identify More Than or Less Than

Worksheet Download:

⤓ Click here to download your pdf worksheet

Answer: Choice A is a fib!

Suggested:

Why You Should Be Using "Which One Doesn't Belong?" to Ignite Student Thinking in Math


Counting Worksheet #5:

Topic: Grouping, Identify More Than or Less Than

Worksheet Download:

⤓ Click here to download your pdf worksheet

Answer: Choice C is a fib!

Suggested:

Number Bonds Explained! (Free Worksheet Included)


Counting Worksheet #6:

Topic: Grouping, Counting Numbers 1-10

Worksheet Download:

⤓ Click here to download your pdf worksheet

Answer: Choice C is a fib!

Suggested:

Play with Math! 10 Fun Ideas for All Ages


Are you looking for more super fun Kindergarten Math Worksheets?

The best-selling workbook 101 Kindergarten Math Worksheets: Super Fun Math Activities for Ages 4-7 is now available as a PDF download. You can get yours today by clicking here.


Counting Worksheet #7:

Topic: Grouping, Counting Numbers 1-10

Worksheet Download:

⤓ Click here to download your pdf worksheet

Answer: Choice C is a fib!

Suggested:

Free Printable Fraction Chart for Kids


Counting Worksheet #8:

Topic: Grouping, Counting Numbers 10-15

Worksheet Download:

⤓ Click here to download your pdf worksheet

Answer: Choice B is a fib!

Suggested:

Bar Charts and Bar Graphs Explained!


Counting Worksheet #9:

Topic: Grouping, More/Less Than, Counting up to 20

Worksheet Download:

⤓ Click here to download your pdf worksheet

Answer: Choice A is a fib!

Suggested:

Free Printable Multiplication Chart (Times Table Practice for Kids)


Counting Worksheet #10:

Topic: Grouping, Comparing Numbers, Counting up to 20

Worksheet Download:

⤓ Click here to download your pdf worksheet

Answer: Choice B is a fib!

Suggested:

101 Kindergarten Math Worksheets Workbook for Ages 4-7


Thoughts? Share your questions and suggestions in the comments section below!

(Never miss a Mashup Math blog--click here to get our weekly newsletter!)

By Anthony Persico

Anthony is the content crafter and head educator for YouTube's MashUp Math and an advisor to Amazon Education's 'With Math I Can' Campaign. You can often find me happily developing animated math lessons to share on my YouTube channel . Or spending way too much time at the gym or playing on my phone.

You Might Also Like…

Comment

5 Awesome 8th Grade Scientific Notation Activities

1 Comment

5 Awesome 8th Grade Scientific Notation Activities

8thGrade.jpg

Are you looking for fun and engaging activities for helping your kids understand scientific notation?

You can use the following activity ideas to differentiate your instruction and help your kids to gain a deeper conceptual understanding of this challenging topic:


via teacherspayteachers.com

via teacherspayteachers.com

1.) Scientific Notation Sort Cards via Amazing Mathematics

Activity Description:

This hands-on sorting activity consists of 22 matching Scientific & Standard notation pairs. Students will cut out a mixture of 22 Scientific & Standard notation numbers, convert them to the other type of notation, and then glue them next to the corresponding number.

Click here to learn more.


via teacherspayteachers.com

via teacherspayteachers.com

2.) Scientific Notation Puzzle via Math Dyal

Activity Description:

Give this hands-on activity a try for a fun way to practice writing small and large numbers using scientific notation. Students will need to "attend to precision" because several of the problems have the same coefficient but different exponents - forcing students to really focus on the function of the exponent. 

Click here to learn more.


MM.jpg

3.) Scientific Notation Explained in the Real-World!

(Video Lesson) via Mashup Math

Activity Description:

This animated math video lesson is the perfect introduction to the concepts and procedures associated with scientific notation. The lesson includes several real-world examples of how to use scientific notation to express large numbers such as the population of the state of Arizona!

Click here to watch the video on YouTube!


Do YOU need free. helpful, and engaging math resources? Access over 100 FREE K-12 Math Video Lessons and Animations on YouTube? Subscribe to our channel (100% free with your Gmail account) and access the full library!


via commoncorematerial.com

via commoncorematerial.com

4.) Foldable Wheel Graphic Organizer via Common Core Material

Activity Description:

This foldable has two layers: example and steps. Students will be solving 4 problems on adding, subtracting, multiplying, and dividing numbers in scientific notation. This foldable is a great handheld study tool or can be glued into their interactive notebooks. In addition, students can personalize their foldables by coloring them. Your students will love this! 

Click here to learn more.


via teacherspayteachers.com

via teacherspayteachers.com

5.) Scientific Notation Maze via Amazing Mathematics

Activity Description:

This maze consists of 11 numbers that students must convert from standard notation to scientific notation. This maze consists of "big" and "small" numbers that require a both positive and negative exponents. Not all boxes are used in the maze to prevent students from just figuring out the route.

Click here to learn more.


Note: Learning Standard: Perform operations with numbers expressed in scientific notation, including problems where both decimal and scientific notation are used. Use scientific notation and choose units of appropriate size for measurements of very large or very small quantities (e.g., use millimeters per year for seafloor spreading). Interpret scientific notation that has been generated by technology.

Did I miss a great activity for teaching Scientific Notation? Share your thoughts and suggestions in the comments section below!

(Never miss a Mashup Math blog--click here to get our weekly newsletter!)

NewBlogImage.png

By Anthony Persico

Anthony is the content crafter and head educator for YouTube's MashUp Math and an advisor to Amazon Education's 'With Math I Can' Campaign. You can often find me happily developing animated math lessons to share on my YouTube channel . Or spending way too much time at the gym or playing on my phone.

 
Pin.jpg
 

1 Comment

7 Engaging Halloween-Themed Math Activities

Comment

7 Engaging Halloween-Themed Math Activities

Halloween is the first big holiday of the school year and an exciting time for students and teachers alike.

As we approach the second half of October, math teachers would be ghoulish not to take advantage of their students’ enthusiasm and Halloween spirit.

There are countless opportunities to creatively incorporate fun and engaging Halloween-themed math activities into your lessons. By tapping into the October excitement, your students will have a more meaningful learning experience.

Looking for ideas? Try adding one of the following fun and engaging Halloween-themed activities into your upcoming lesson plans:

1.) The Hershey Kiss Memory Game

Is there any better motivator than Hershey’s chocolate? This math game from Kids Activities Blog requires you to put a small garage sale dot sticker on the bottoms of Hershey Kisses along with corresponding multiplication facts. Students then take turns flipping them over looking for a match. When you find one, the chocolate is yours to keep! Try using this as a warm-up exercise at the beginning of a class period to get students engaged immediately.

Image Source: www.kidsactivitiesblog.com.

Image Source: www.kidsactivitiesblog.com.

2.) Sample Space, Probability, and M&M's  

Image Source: www.mms.com

Image Source: www.mms.com

Candies like M&Ms can be used as an engaging tool for students to explore sample sizes and probability. Try placing students in groups with a large bowl of M&M's. After sorting the candies by color and creating a tally chart, give them each a fun-sized pouch and have them predict the frequency of each color based on their data collection. Students will love making reasonable predictions and exploring why or why not their results made sense.


3.) Exponential Growth...With Zombies!

Exponential growth and decay are often taught in the context of human populations, but what about zombie populations? This Halloween-themed video lesson explores the concept of exponential growth in the context of a zombie apocalypse. The video touches on concepts such as growth and decay, exponential functions and why they never pass through the origin, and how to apply the population growth formula. Middle school and algebra teachers can use the lesson in an introductory context, while higher level teachers can have students work through all of the practice activities.

Video Source: www.youtube.com/mashupmath

4.) Graveyard Frequency Tables

Image Source: http://missgiraffesclass.blogspot.com

Image Source: http://missgiraffesclass.blogspot.com

This simple activity from Miss Giraffe's Class Blog gets students to practice collecting and analyzing data using manipulatives. Students are given cotton swabs, black construction paper, and cups full of small Halloween erasers (you can purchase these in large quantities at most party stores), which they will categorize with a frequency table using bones (cotton swabs) as tally marks. Teachers can extend the activity by having students graph their results in a bar chart.   

5.) Halloween Bone Bridge

This Halloween STEM project from Plans for a Better Tomorrow Blog is highly exploratory and hands-on. The lesson can be modified for elementary or secondary math lessons. Students will use materials including cotton swabs, clothes pins, rubber bands, and pumpkin-shaped candies to build a “bone bridge” for length, strength, and/or capacity. Teachers can assess these attributes by having students demonstrate how many pieces of pumpkin candy that their design can support. Watch the video below to learn more about this project and the variations of assessment for different ability levels.  

6.) Counting Hands Dice Activity

Image Source: www.jdaniel4smom.com

Image Source: www.jdaniel4smom.com

Now this is what I call a hands-on activity! This spooky idea from JDaniel4's Mom Blog has students create a seriously scary manipulative for exploring math operations using rubber gloves, uncooked beans, rubber bands, a measuring spoon, and dice. The physical nature of this activity helps students to visualize math facts and strengthen their number sense through engaging in a hands-on learning experience. It's a fun activity to do in the classroom or at home.


7.) The Halloween Place-Value Poem   

This short video is for elementary level students and teaches the concept of place value in the form of a PG Halloween poem. With over 10,000 views, this popular YouTube video and its silly and spooky sound effects will have your students reciting the place values from the ones all the way to the millions and laughing a whole lot in between. You can access the lyrics to the poem here so that students can read along while they watch.


🎃Have another idea for an awesome Halloween math activity? Creep it real and share yours in the comments below.

By Anthony Persico

Anthony is the content crafter and head educator for YouTube's MashUp Math and an advisor to Amazon Education's 'With Math I Can' Campaign. You can often find me happily developing animated math lessons to share on my YouTube channel . Or spending way too much time at the gym or playing on my phone.

You Might Also Like…

 
Follow Us on Pinterest!

Follow Us on Pinterest!


Comment